Standard workflow to generate figure
- Update: 6/22/2022
- Select objects
### Step1 : Define Objects (snRNA, ST, and CellTrek) to use
sn_use  = sn_akimale
ST_use  = ST_akimale
celltrek_use = celltrek_list[[sample]]
graph_use = graph_list[[sample]]### Step2 : Define which cell type to target, and Generate plot obj
cell_type_plt = 'Immune' # Target cell type
km_use = 3 # k for kmeans clustering used for Neighborhood-celltype-based clustering
palette_use_cluster = MakeClusterPalette(k = km_use, celltype = cell_type_plt) # palette for the kmeans cluster
cell_column = 'cell_type_Abbr'
#### Make PLOT OBJ
plt_info_akimale = PrepareSpatialPlotObject(celltrek_use,
graph_use,
km_use = km_use,
palette_cluster = palette_use_cluster,
cell_column = cell_column,
palette = col_cell_type, celltype_highlight = cell_type_plt, n_order = 1)
obj_use = plt_info_akimale- ST + snPLOT, just a way to quickly visualize original data
### Step 3 Make ST and snRNA Dimplot
p_sn_dim = DimPlot(sn_use, group.by = 'cell_type_Abbr', label = T) +
scale_color_manual(values = obj_use$Palettes$palette_celltype) + theme(aspect.ratio = 1)
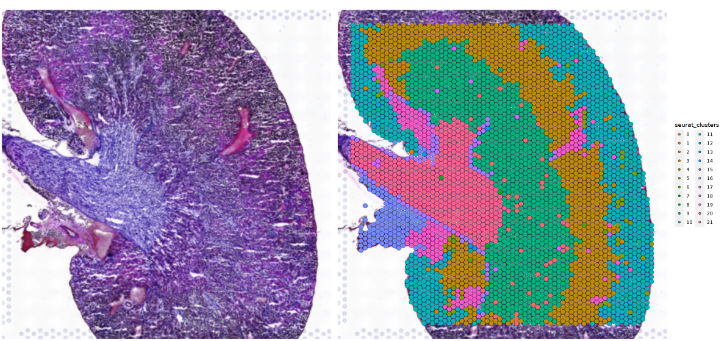
SpatialDimPlot(ST_use, group.by = 'seurat_clusters')|p_sn_dim
SpatialDimPlot(ST_use, group.by = 'seurat_clusters', alpha = 0) + NoLegend()|SpatialDimPlot(ST_use, group.by = 'seurat_clusters')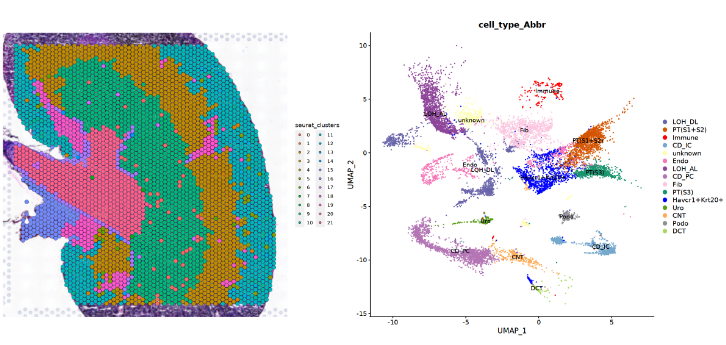
- CellTrek: OVERALL
### Step 4: CellTrek Overall
p_allpt = MakeDelaunayGraphPlot(obj_use, show_all_points = T)
p_allpt_noedge = MakeDelaunayGraphPlot(obj_use, show_all_points = T, show_edge = F)
p_allpt_noedge|p_allpt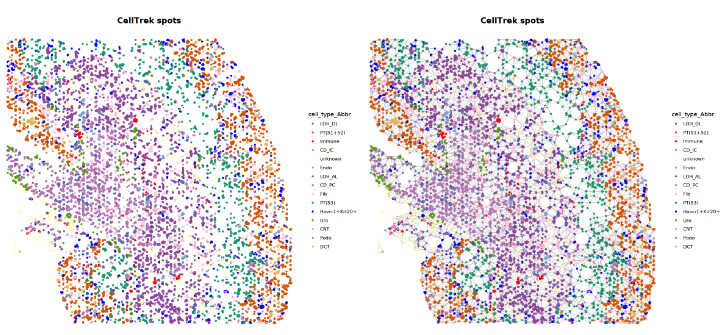
- Delaunry with neighbor
- Make Delauney Plots - Show Neighbor
### Step 5: CellTrek Neighborhood Spatial Distribution
options(repr.plot.width = 20, repr.plot.height = 10) # used in Jupyter notebook
p0 = MakeDelaunayGraphPlot(obj_use)
p1 = p0 %>% AddClusterHighlight(obj_use)
(p0|p1)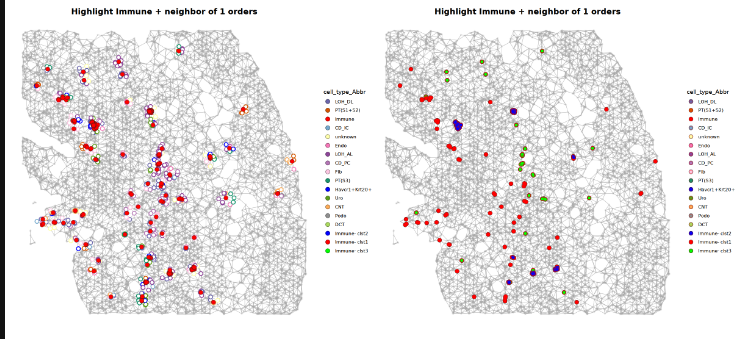
- Make Delauney And Profile Plot
### Step 6: CellTrek Neighborhood Profile
options(repr.plot.width = 20, repr.plot.height = 10) # used in Jupyter notebook
p0 = MakeDelaunayGraphPlot(obj_use)
p1 = p0 %>% AddClusterHighlight(obj_use, stroke = 0.8, pt_size = 3)
MakeNeighborProfilePlotV2(plot_info_obj = obj_use)| p1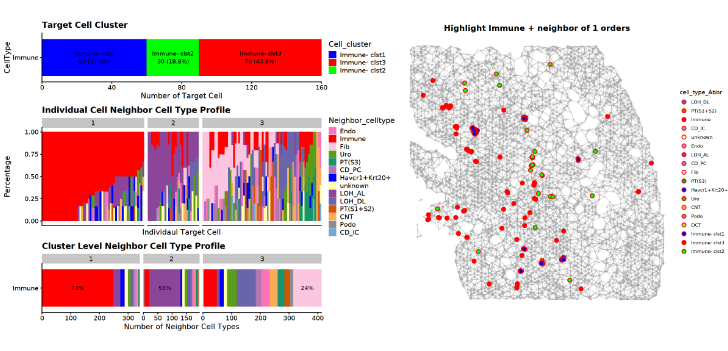
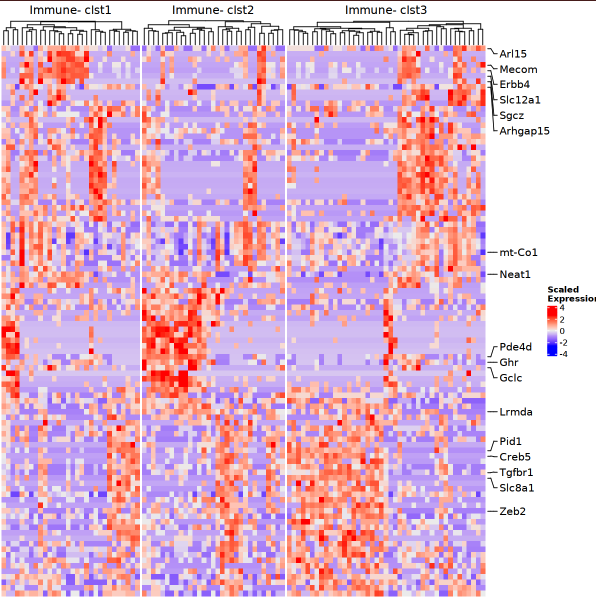
## Make heatmap
options(repr.plot.width = 10, rerp.plot.height = 5) # used in Jupyter notebook
p = MakeClusterHeatmap(obj_use, sn_use, assay = 'SCT', n_gene = 100)
p
# 1. Select Data
sample = '20210129-AKI3M'
cell_type_plt = 'Havcr1+Krt20+'
cell_column = 'cell_type_Abbr'
km_use = 3
palette_use_cluster = MakeClusterPalette(k = km_use, celltype = cell_type_plt)

# Step 1 - Make PLOT OBJ
plt_info_akimale = PrepareSpatialPlotObject(celltrek_list[[sample]],
                                            graph_list[[sample]],
                                            km_use = km_use,
                                            palette_cluster = palette_use_cluster,
                                            cell_column = cell_column,
                                            palette = col_cell_type, celltype_highlight = cell_type_plt, n_order = 1)

# Select obj
obj_use = plt_info_akimale
sn_use  = sn_akimale
ST_use = ST_akimale## PLOT ALL! (This block is standard can copy and use)
# ST + snPLOT
options(repr.plot.width = 20, repr.plot.height = 10)
p_sn_dim = DimPlot(sn_use, group.by = group_by, label = T) +
scale_color_manual(values = obj_use$Palettes$palette_celltype) + theme(aspect.ratio = 1)
SpatialDimPlot(ST_use, group.by = 'seurat_clusters')|p_sn_dim
SpatialDimPlot(ST_use, group.by = 'seurat_clusters', alpha = 0) + NoLegend()|SpatialDimPlot(ST_use, group.by = 'seurat_clusters')
## OVERAL
p_allpt = MakeDelaunayGraphPlot(obj_use, show_all_points = T)
p_allpt_noedge = MakeDelaunayGraphPlot(obj_use, show_all_points = T, show_edge = F)
p_allpt_noedge|p_allpt
# Delaunry with neighbor
## Make Delauney Plots - Show Neighbor
options(repr.plot.width = 20, repr.plot.height = 10)
p0 = MakeDelaunayGraphPlot(obj_use)
p1 = p0 %>% AddClusterHighlight(obj_use)
(p0|p1)
## Profile
## Make Delauney And Profile Plot
options(repr.plot.width = 20, repr.plot.height = 10)
p0 = MakeDelaunayGraphPlot(obj_use)
p1 = p0 %>% AddClusterHighlight(obj_use, stroke = 0.8, pt_size = 3)
MakeNeighborProfilePlotV2(plot_info_obj = obj_use)| p1
## Make heatmap
options(repr.plot.width = 10, rerp.plot.height = 5)
p = MakeClusterHeatmap(obj_use, sn_use, assay = 'SCT', n_gene = 100)
p