Edge based plot
- Refer to standard workflow to get the
plot_obj
-
EdgePlotByCellin/Graph/function_CellTrek_graph_edge.r
## Demo
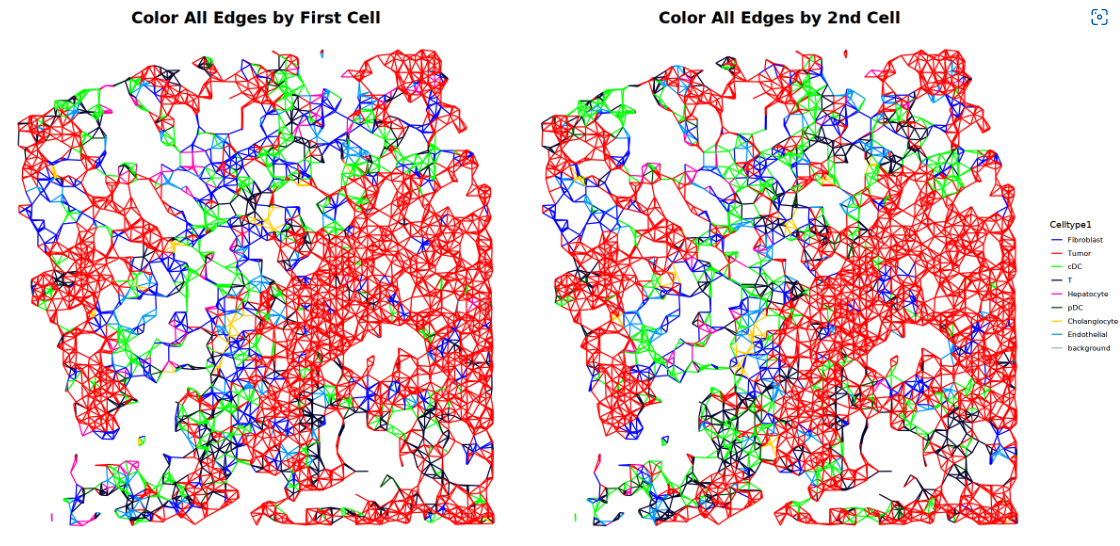
# All Cells
pp0=EdgePlotByCell(plot_obj_snonly, color_edge_by = 'cell1', plt_title = 'Color All Edges by First Cell')|
EdgePlotByCell(plot_obj_snonly, color_edge_by = 'cell2', plt_title = 'Color All Edges by 2nd Cell') + NoLegend()
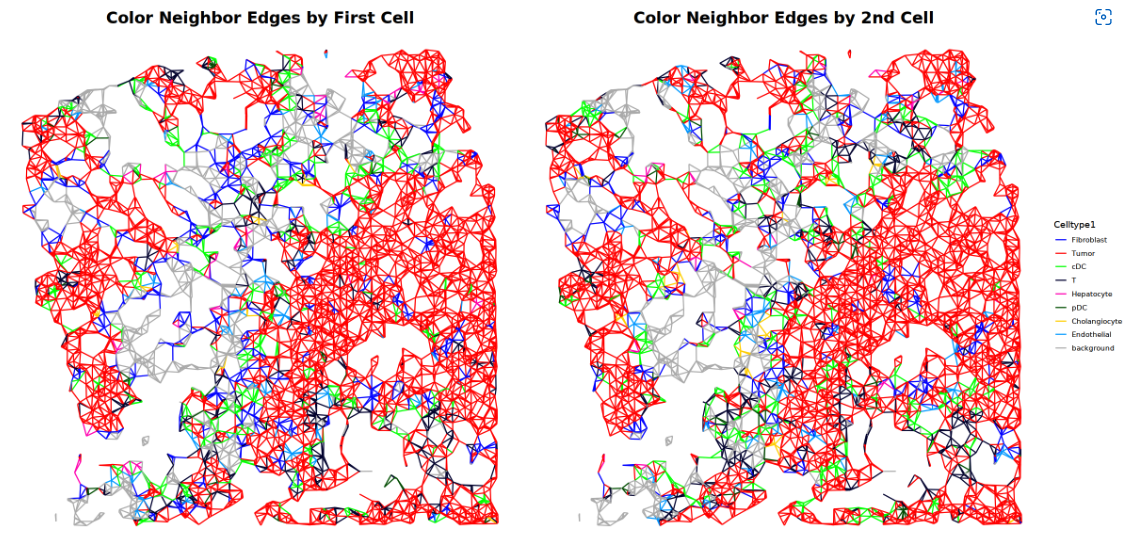
# Highlight the neighborhood of target cells only
pp1=EdgePlotByCell(plot_obj_snonly, color_edge_by = 'cell1', highlight_neighbor=T, plt_title = 'Color Neighbor Edges by First Cell')|
EdgePlotByCell(plot_obj_snonly, color_edge_by = 'cell2', highlight_neighbor=T, plt_title = 'Color Neighbor Edges by 2nd Cell')+ NoLegend()
pp0 + plot_layout(guides = 'collect')
pp1 + plot_layout(guides = 'collect')
- All Cells
- Highlight the neighborhood of target cells only