DEG plots
DEG plot (developing..)
# Parameters
tmp_sample = '20210129-AKI3M'
obj = celltrek_list[[tmp_sample]]
graph_obj = graph_list[[tmp_sample]]
tmp_celltype = 'Immune'
cell_column = 'cell_type_Abbr'

# STEP1: Get DEG result
marker_list = FindNeighborMarkers(obj, graph_obj, group.by = cell_column, ident = tmp_celltype, n_order = 1)

options(repr.plot.width = 10, repr.plot.height = 10)
# Visualize DEG result
MarkerBubblePlot(marker_list, palette = col_cell_type)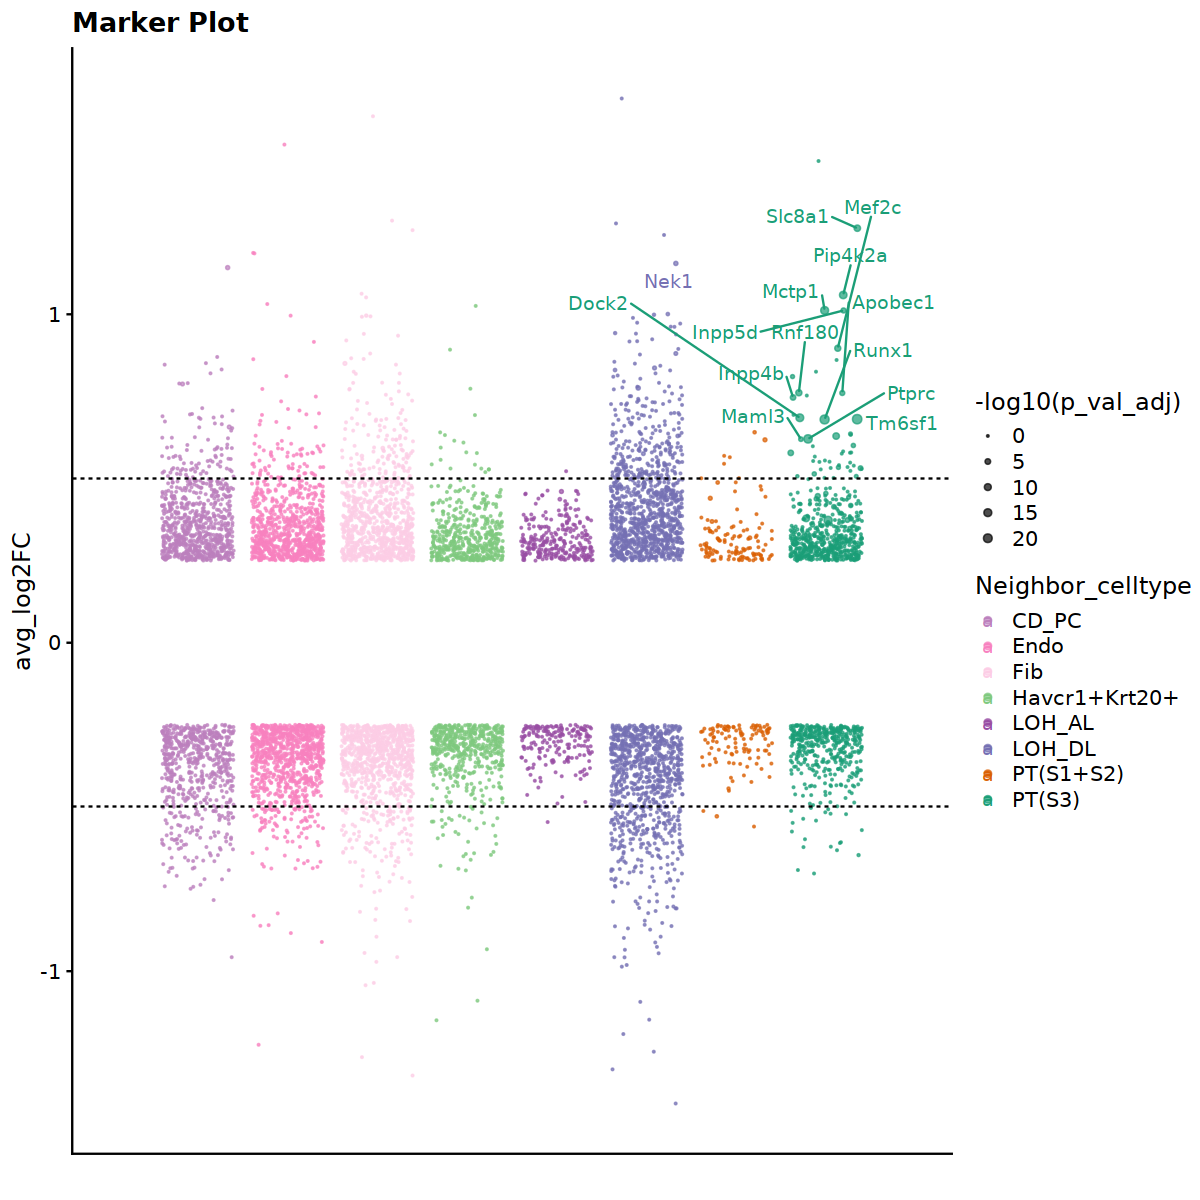
# STEP2: Make VLN plots
vln_all = MakeNeighborMarkerVlnplot(obj, marker_result_list = marker_list, cell_column = cell_column)
# Step3: Visuaize individual genes
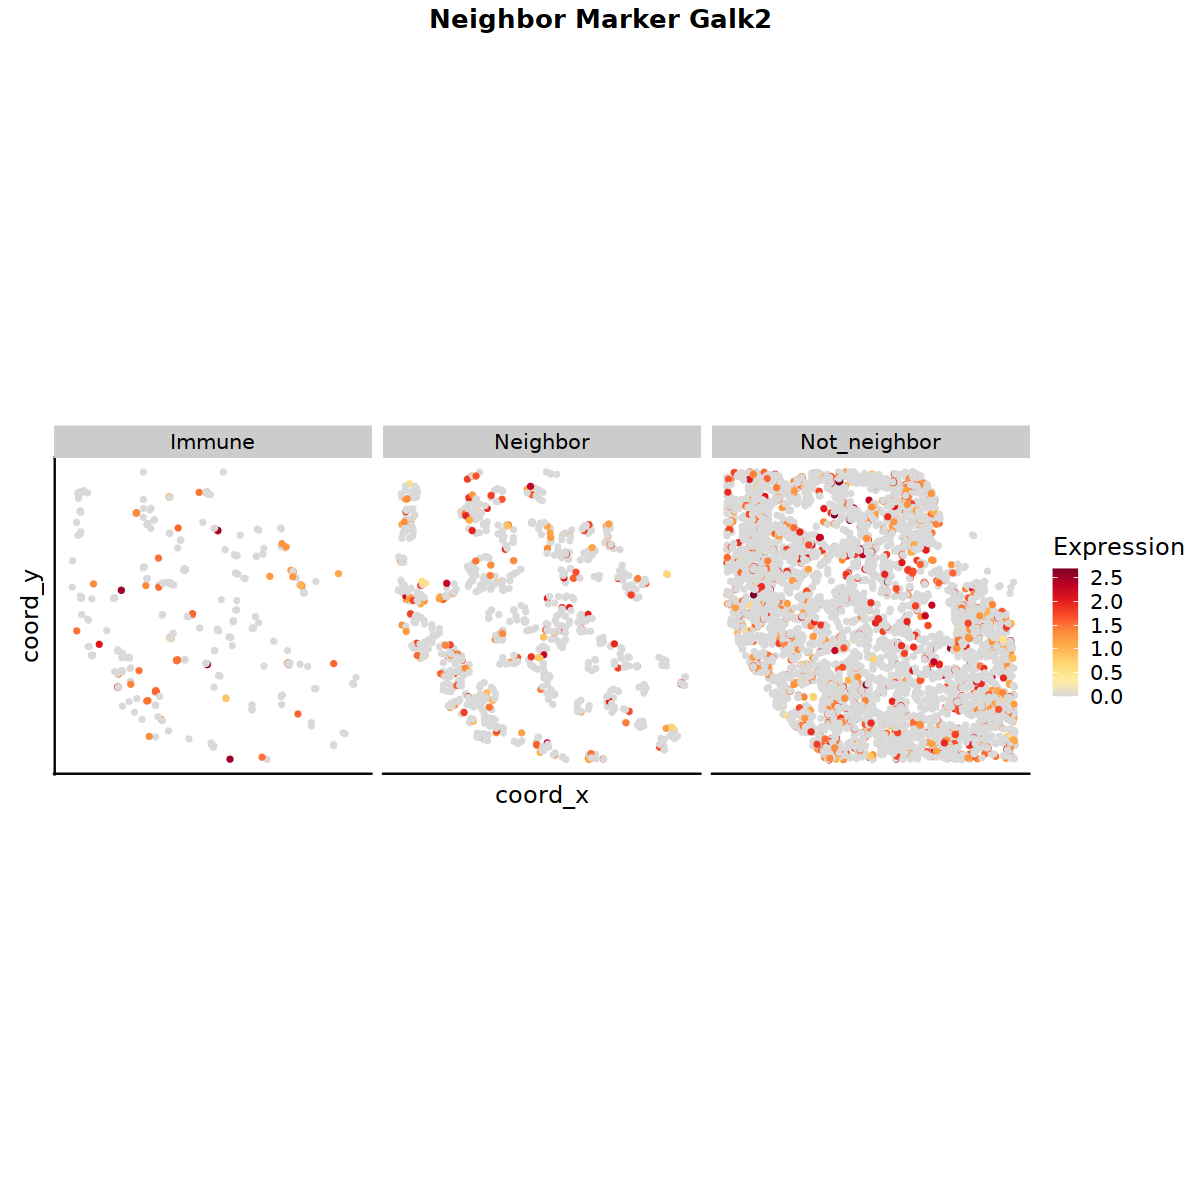
p_st = MarkerSplitSpatialCellTrekPlot(celltrek_obj = celltrek_list[[tmp_sample]], marker_result_list = marker_list, feature = 'Galk2') #, split_cell_col = 'cell_type_Abbr')
#vln_all[[1]]
p_st