Getting Started
Welcome to our guide to getting started with Supabench. This guide will help you understand the basic structure of the app and where to begin.
- Supabase - Built by Supabase team.
- Pocketbase - This project uses Pocketbase as a backend, and the frontend is also based on the Pocketbase admin UI.
- k6 - The load generator used.
- Terraform - SUT and loader infrastructure delivery.
- Grafana - Dashboard for benchmark results.
- Prometheus - Store metrics for benchmark results.
- Telegraf - Send benchmark metrics to Prometheus.
Supabench is a Pocketbase application in which you can create Projects, Benchmarks, and trigger runs. It has a web UI split into the admin UI and the public UI. Admin UI is used to create Projects, Benchmarks and add Secrets for the benchmark. Public UI is used to view the results of the Runs and trigger new Runs.
To run the infrastructure for the benchmark, terraform is used. You should upload an archive with benchmark-related files to the Secrets table. The archive should contain the terraform files for the infrastructure creation (SUT and loader instance) and the k6 scripts with scenarios that will be run to generate load. Please look at the Creating Benchmark guide for more information. Or see the /examples folder in the repository for working examples.
External parts of Supabench include Grafana and Prometheus. Grafana is used to view the detailed reports from the benchmark run and requires you to create the dashboard (see /examples to get started). Prometheus is used to store the metrics for the Runs. You may use different ways to deliver metrics to Prometheus. But I recommend using Telegraf to listen to k6 metrics (xk6-prometheus) and send these metrics to your Prometheus instance (/k6/telegraf.conf).
To make everything work together, we use the following structure:
- We have the Supabench app running with some envs (for example, AWS tokens to create instances to generate load and with SUT). Some other apps should also be installed on the instance with Supabench with secrets provided if it may be used in terraform (
flyctl, for example). - Grafana and Prometheus instances are running, and we have the URL and keys required to send metrics to Prometheus.
- AMI (instance image on AWS) is created with telegraf installed (not required but recommended way to send metrics from k6 to Prometheus), golang installed (to build k6 with xk6 extensions if needed), and/or k6 binary installed, and some OS configs adjusted according to k6 recommendations.
- Use
handleSummaryin your k6 script from helpers in this repo (/k6/summary.js). After each run, this function will be called to generate a summary of the benchmark and send it to the Supabench app.
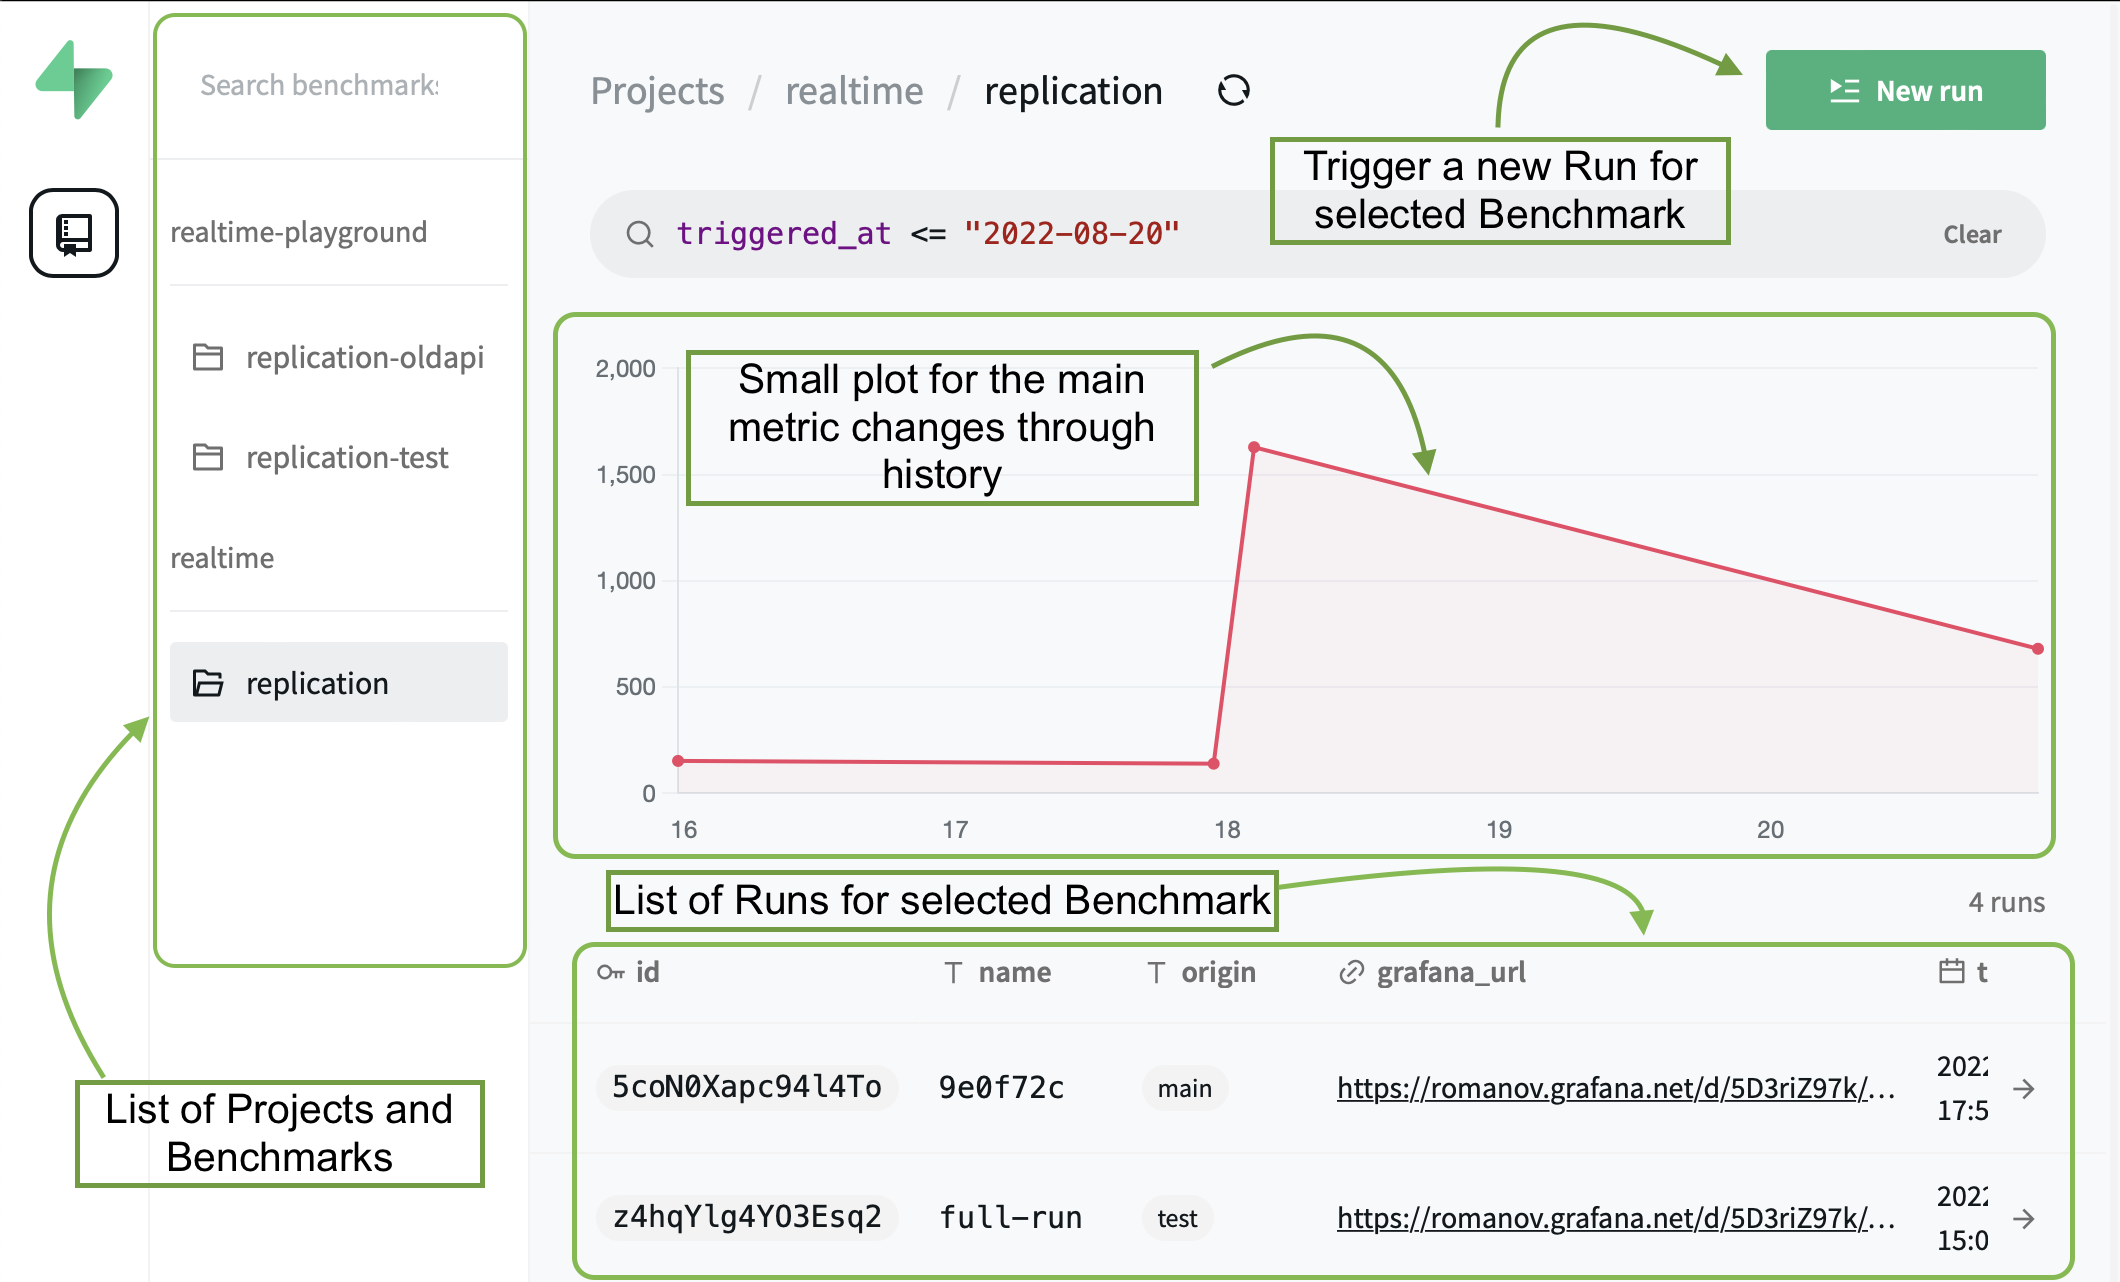
A bit fancier than the admin UI, the public UI is a web app that anyone can access to view the results history of the Runs. And to trigger new Runs (you need to be a logged-in privileged user).
You may also trigger the run with an API call like so:
curl --request POST \
  --url {supabench.url}/api/runs \
  --header 'Authorization: Admin ${JWT_TOKEN}' \
  --data '{"benchmark_id":"${BENCHMARK_ID}","name":"my-testrun","origin":"master"}'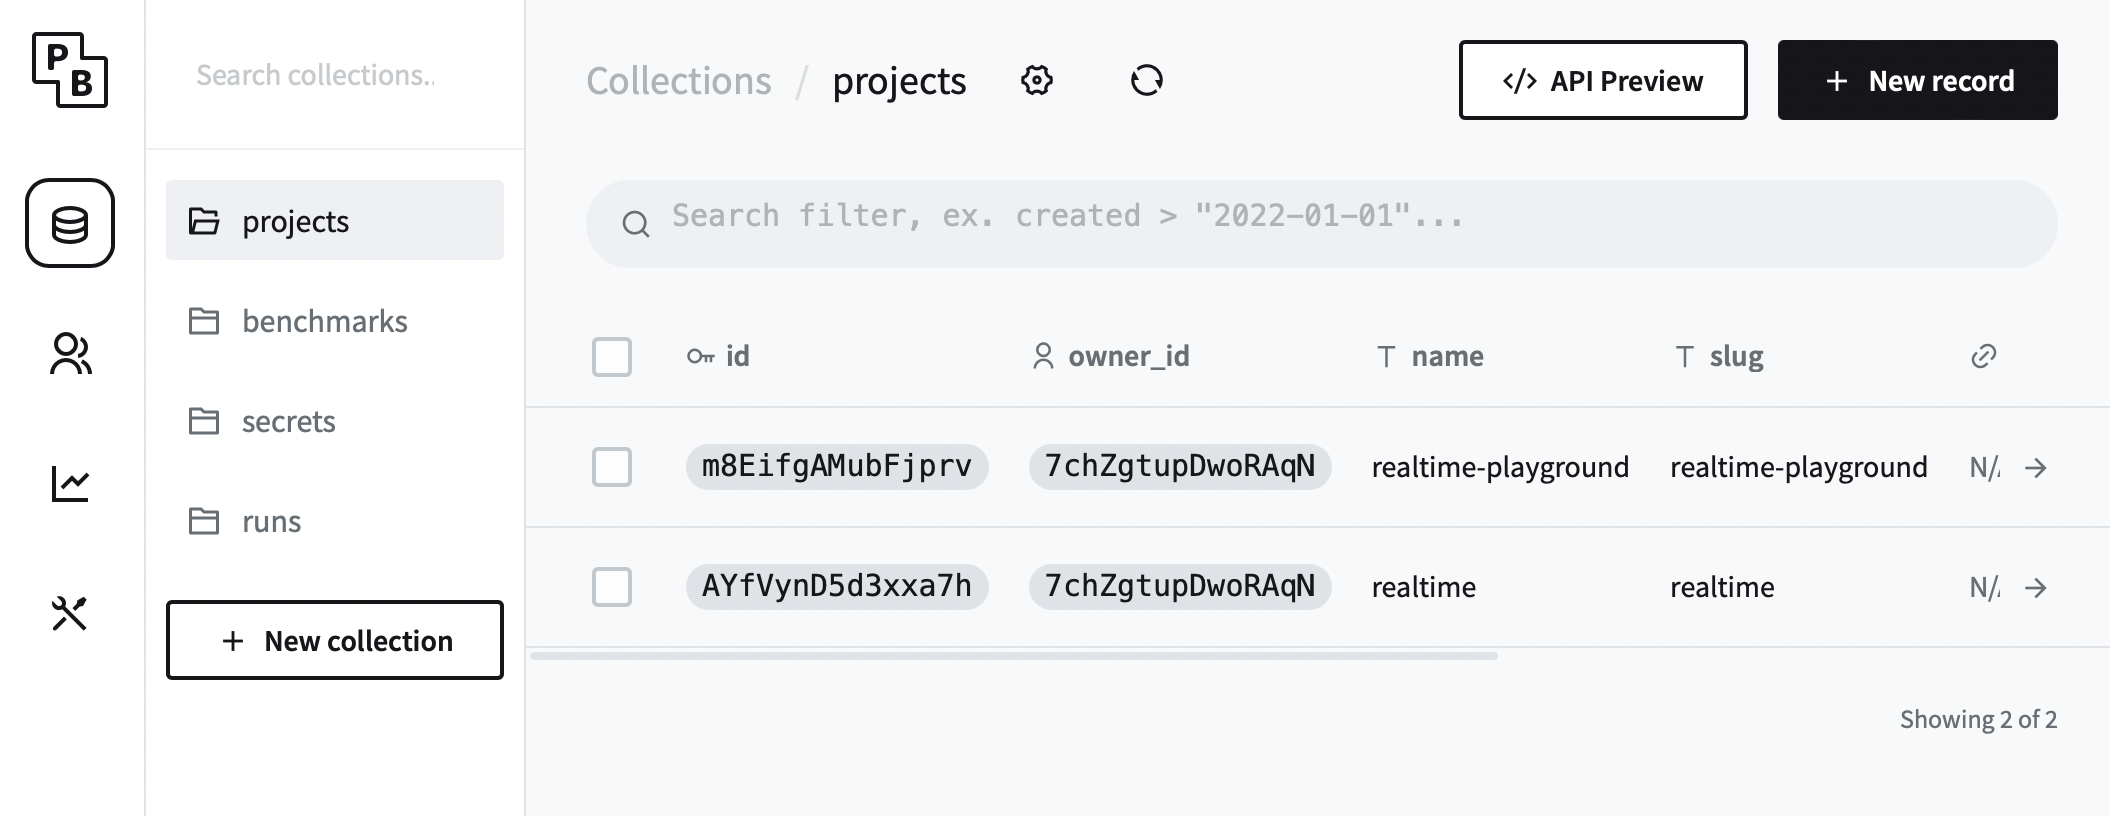
Is a Pocketbase admin UI. You can create or update Projects, Benchmarks, and Secrets using it. Also, you may add new users and admins, make some adjustments to the schema (create new fields, for example), and delete some data. Change Pocketbase settings (setup SMTP, etc.) and see the app logs.
If you have any issues understanding the terms, you may refer to Terminology.