Analyzing Results
This wiki will teach us how to analyze results and use grafana.
The results of performance are most likely to be a chart or charts. We can use Grafana to visualize the metrics. And the more metrics you will be able to get the better.
As the bare minimum, you will be able to get default metrics sent by k6 and the metrics you can get from telegraf if you will use it to understand the health of the instance you are using to create the load.
Additionally, you can get more metrics by exporting metrics from SUT to some place and adding this datasource to your grafana as well.
You can check the /examples folder to find the dashboards that we are using. We actually use some default k6 metrics, some custom k6 metrics, and a fly datasource to get info about Realtime when it is a SUT.
Let's look at the dashboard that we are using to analyze benchmarks for Realtime service.
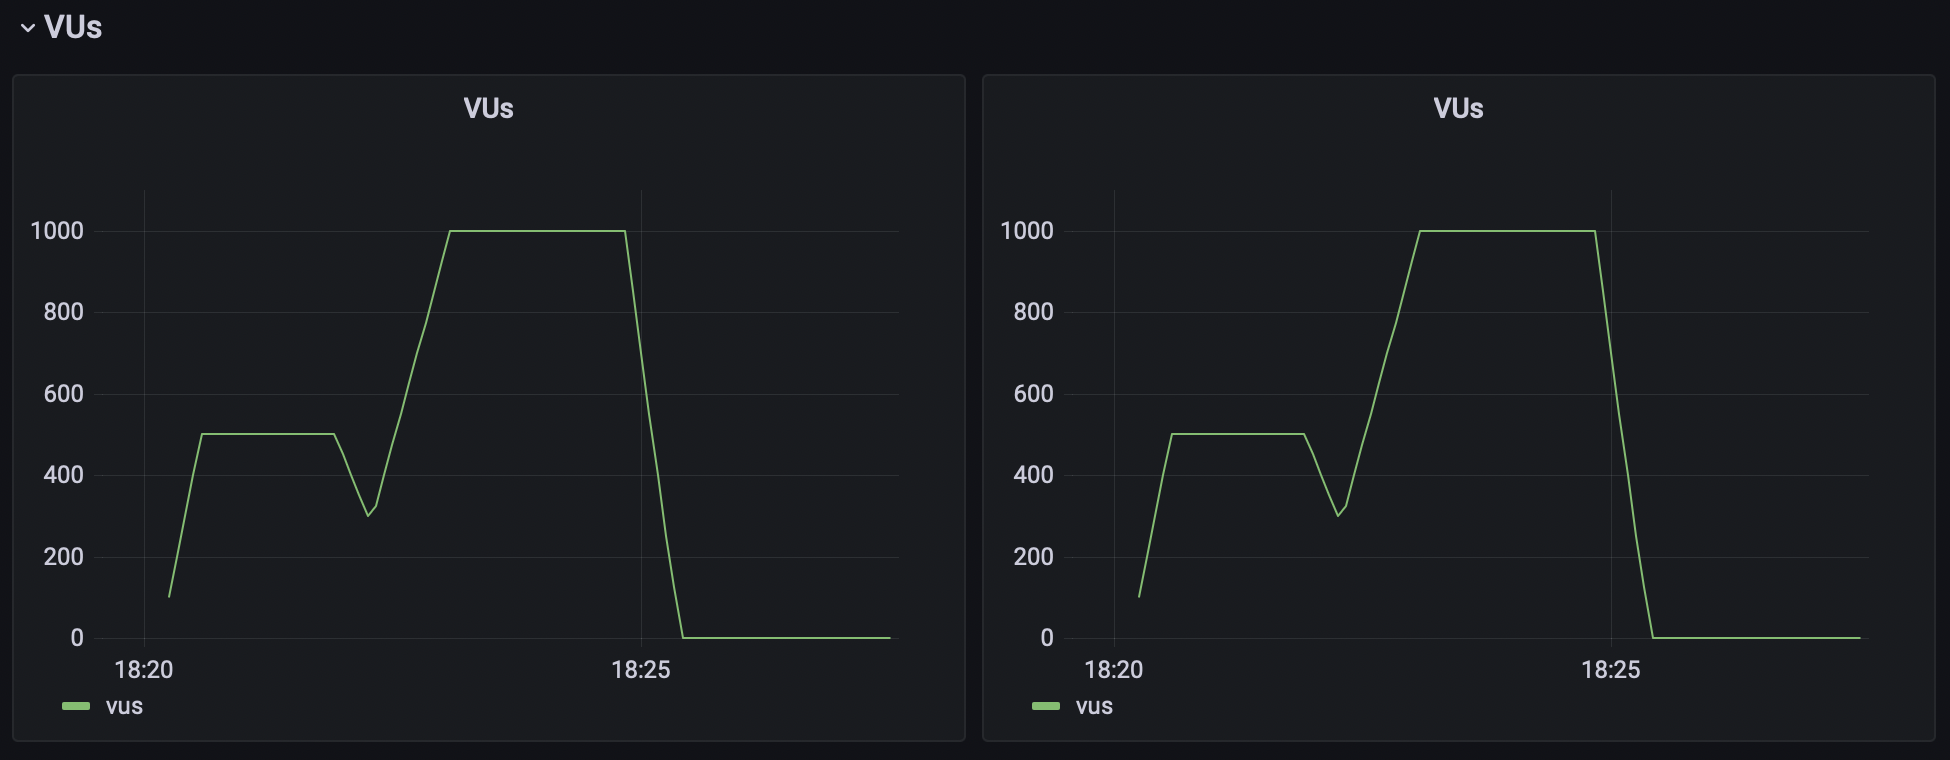
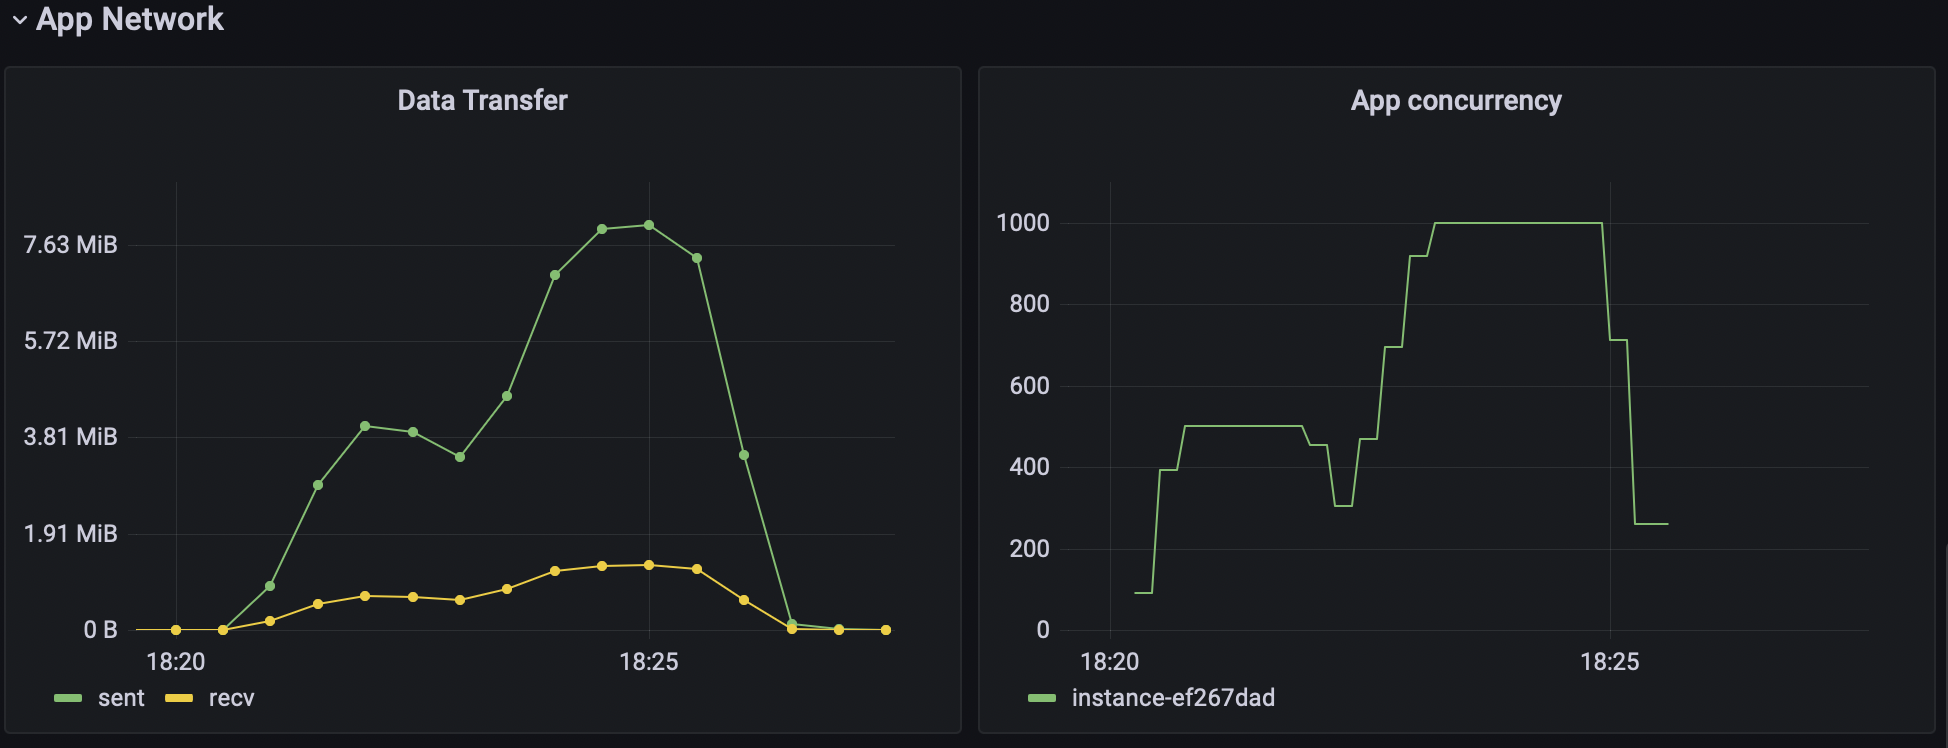
Virtual users (VUs) are the concurrent users that are accessing the service and performing actions specified in k6 scenario script. The VUs chart shows the number of VUs that are accessing the service at a given time.
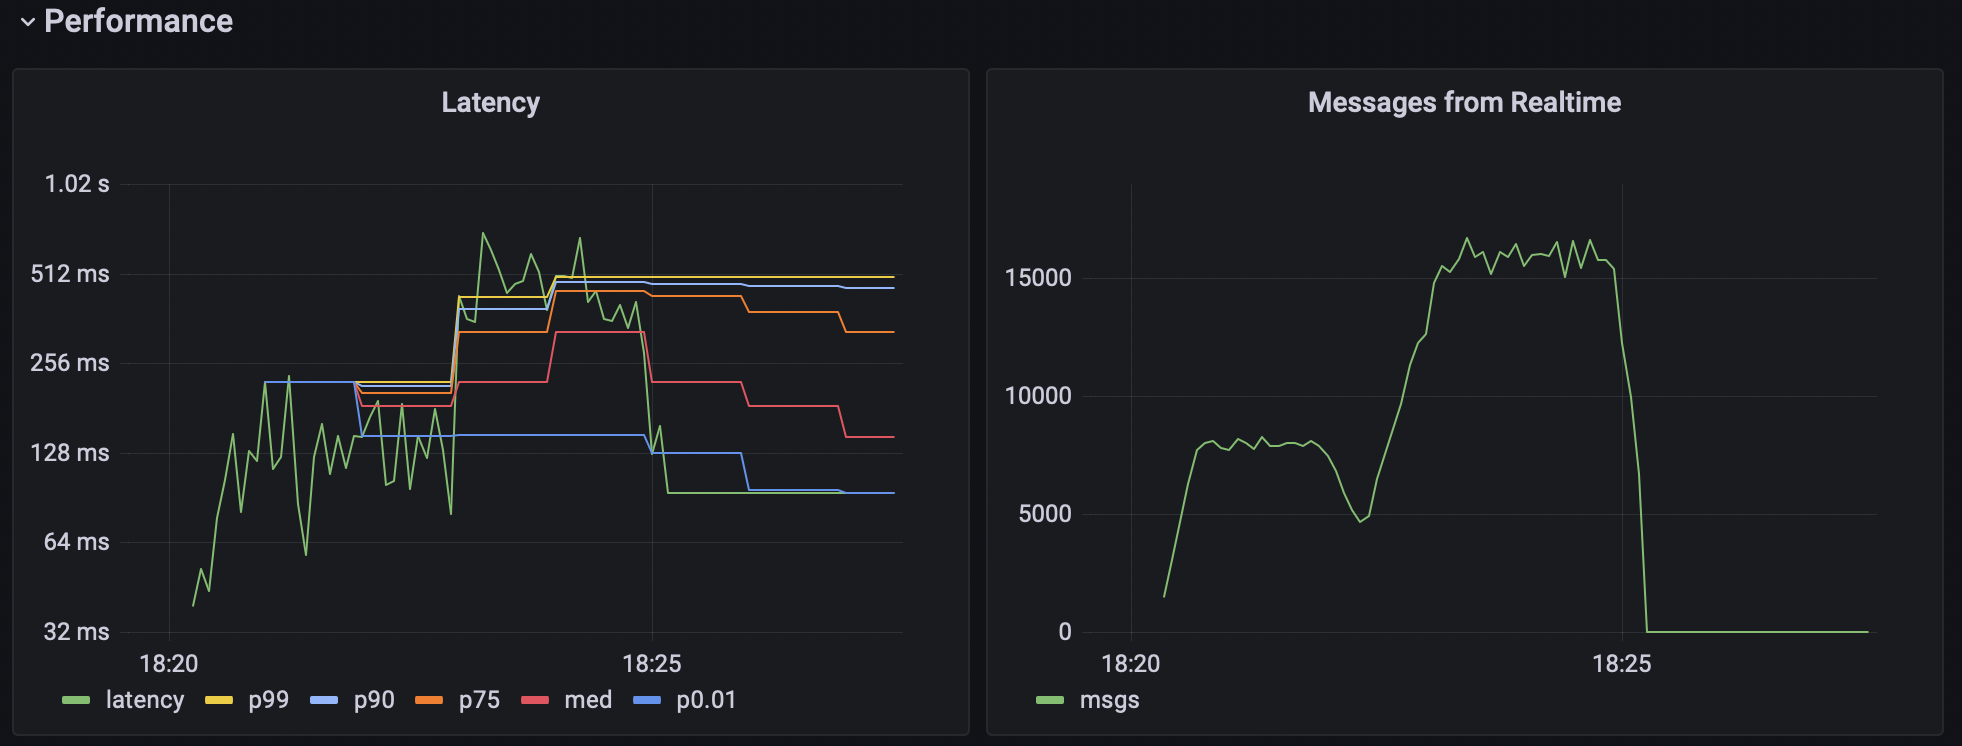
K6 allows you to specify and calculate custom metrics. For the Realtime, for example, latency is very important. Latency is the time between some event happened (like an insert to the database or broadcast message sent) and the moment when a subscribed customer (or VUs) receives the request. And the throughput - the number of events sent by Realtime server to all subscribed clients per second.
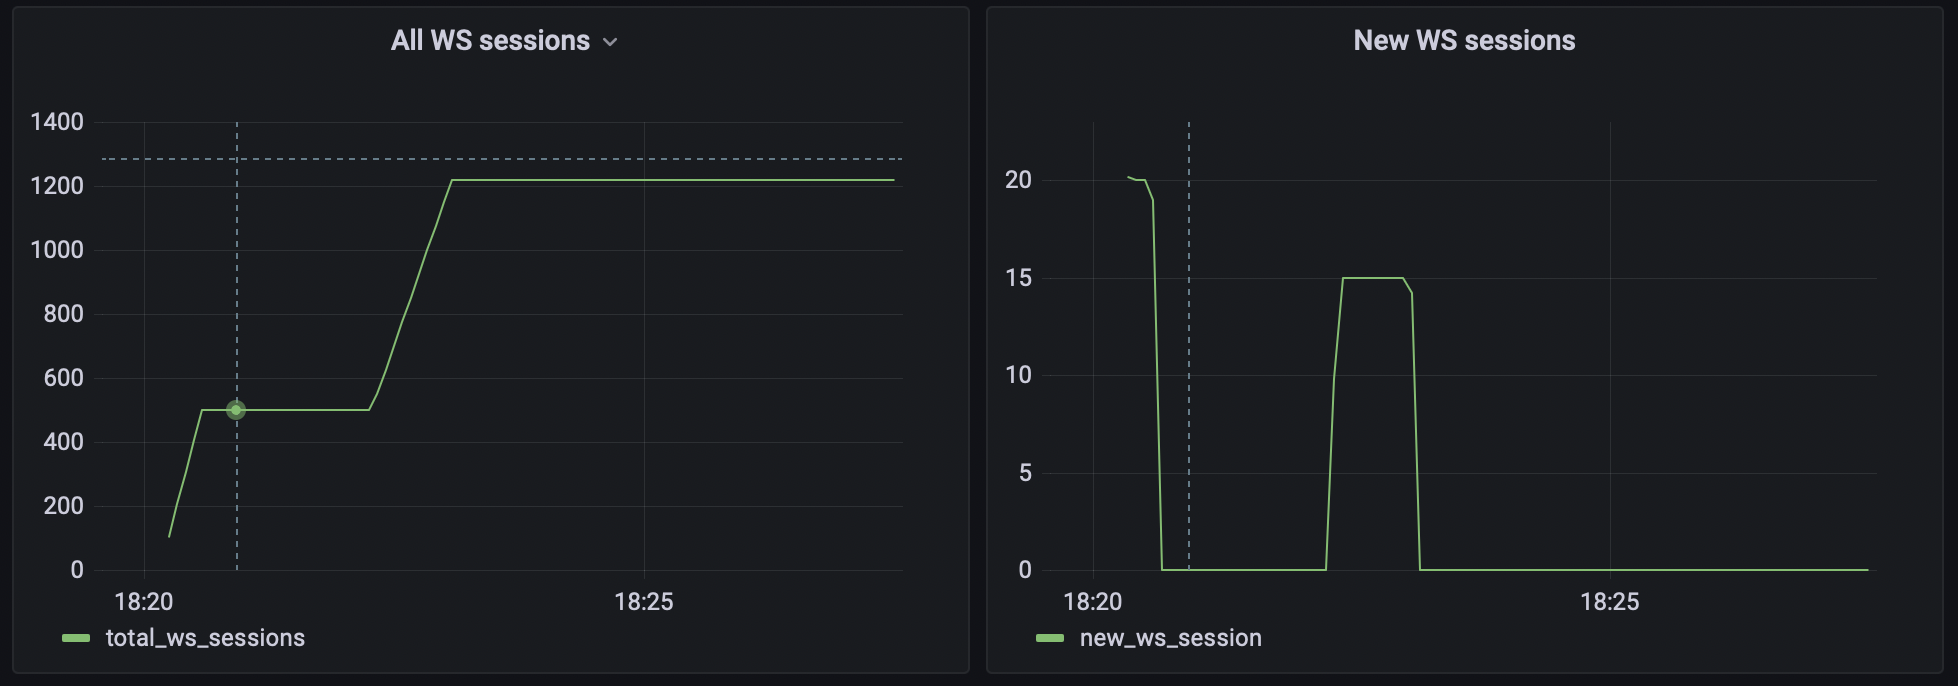
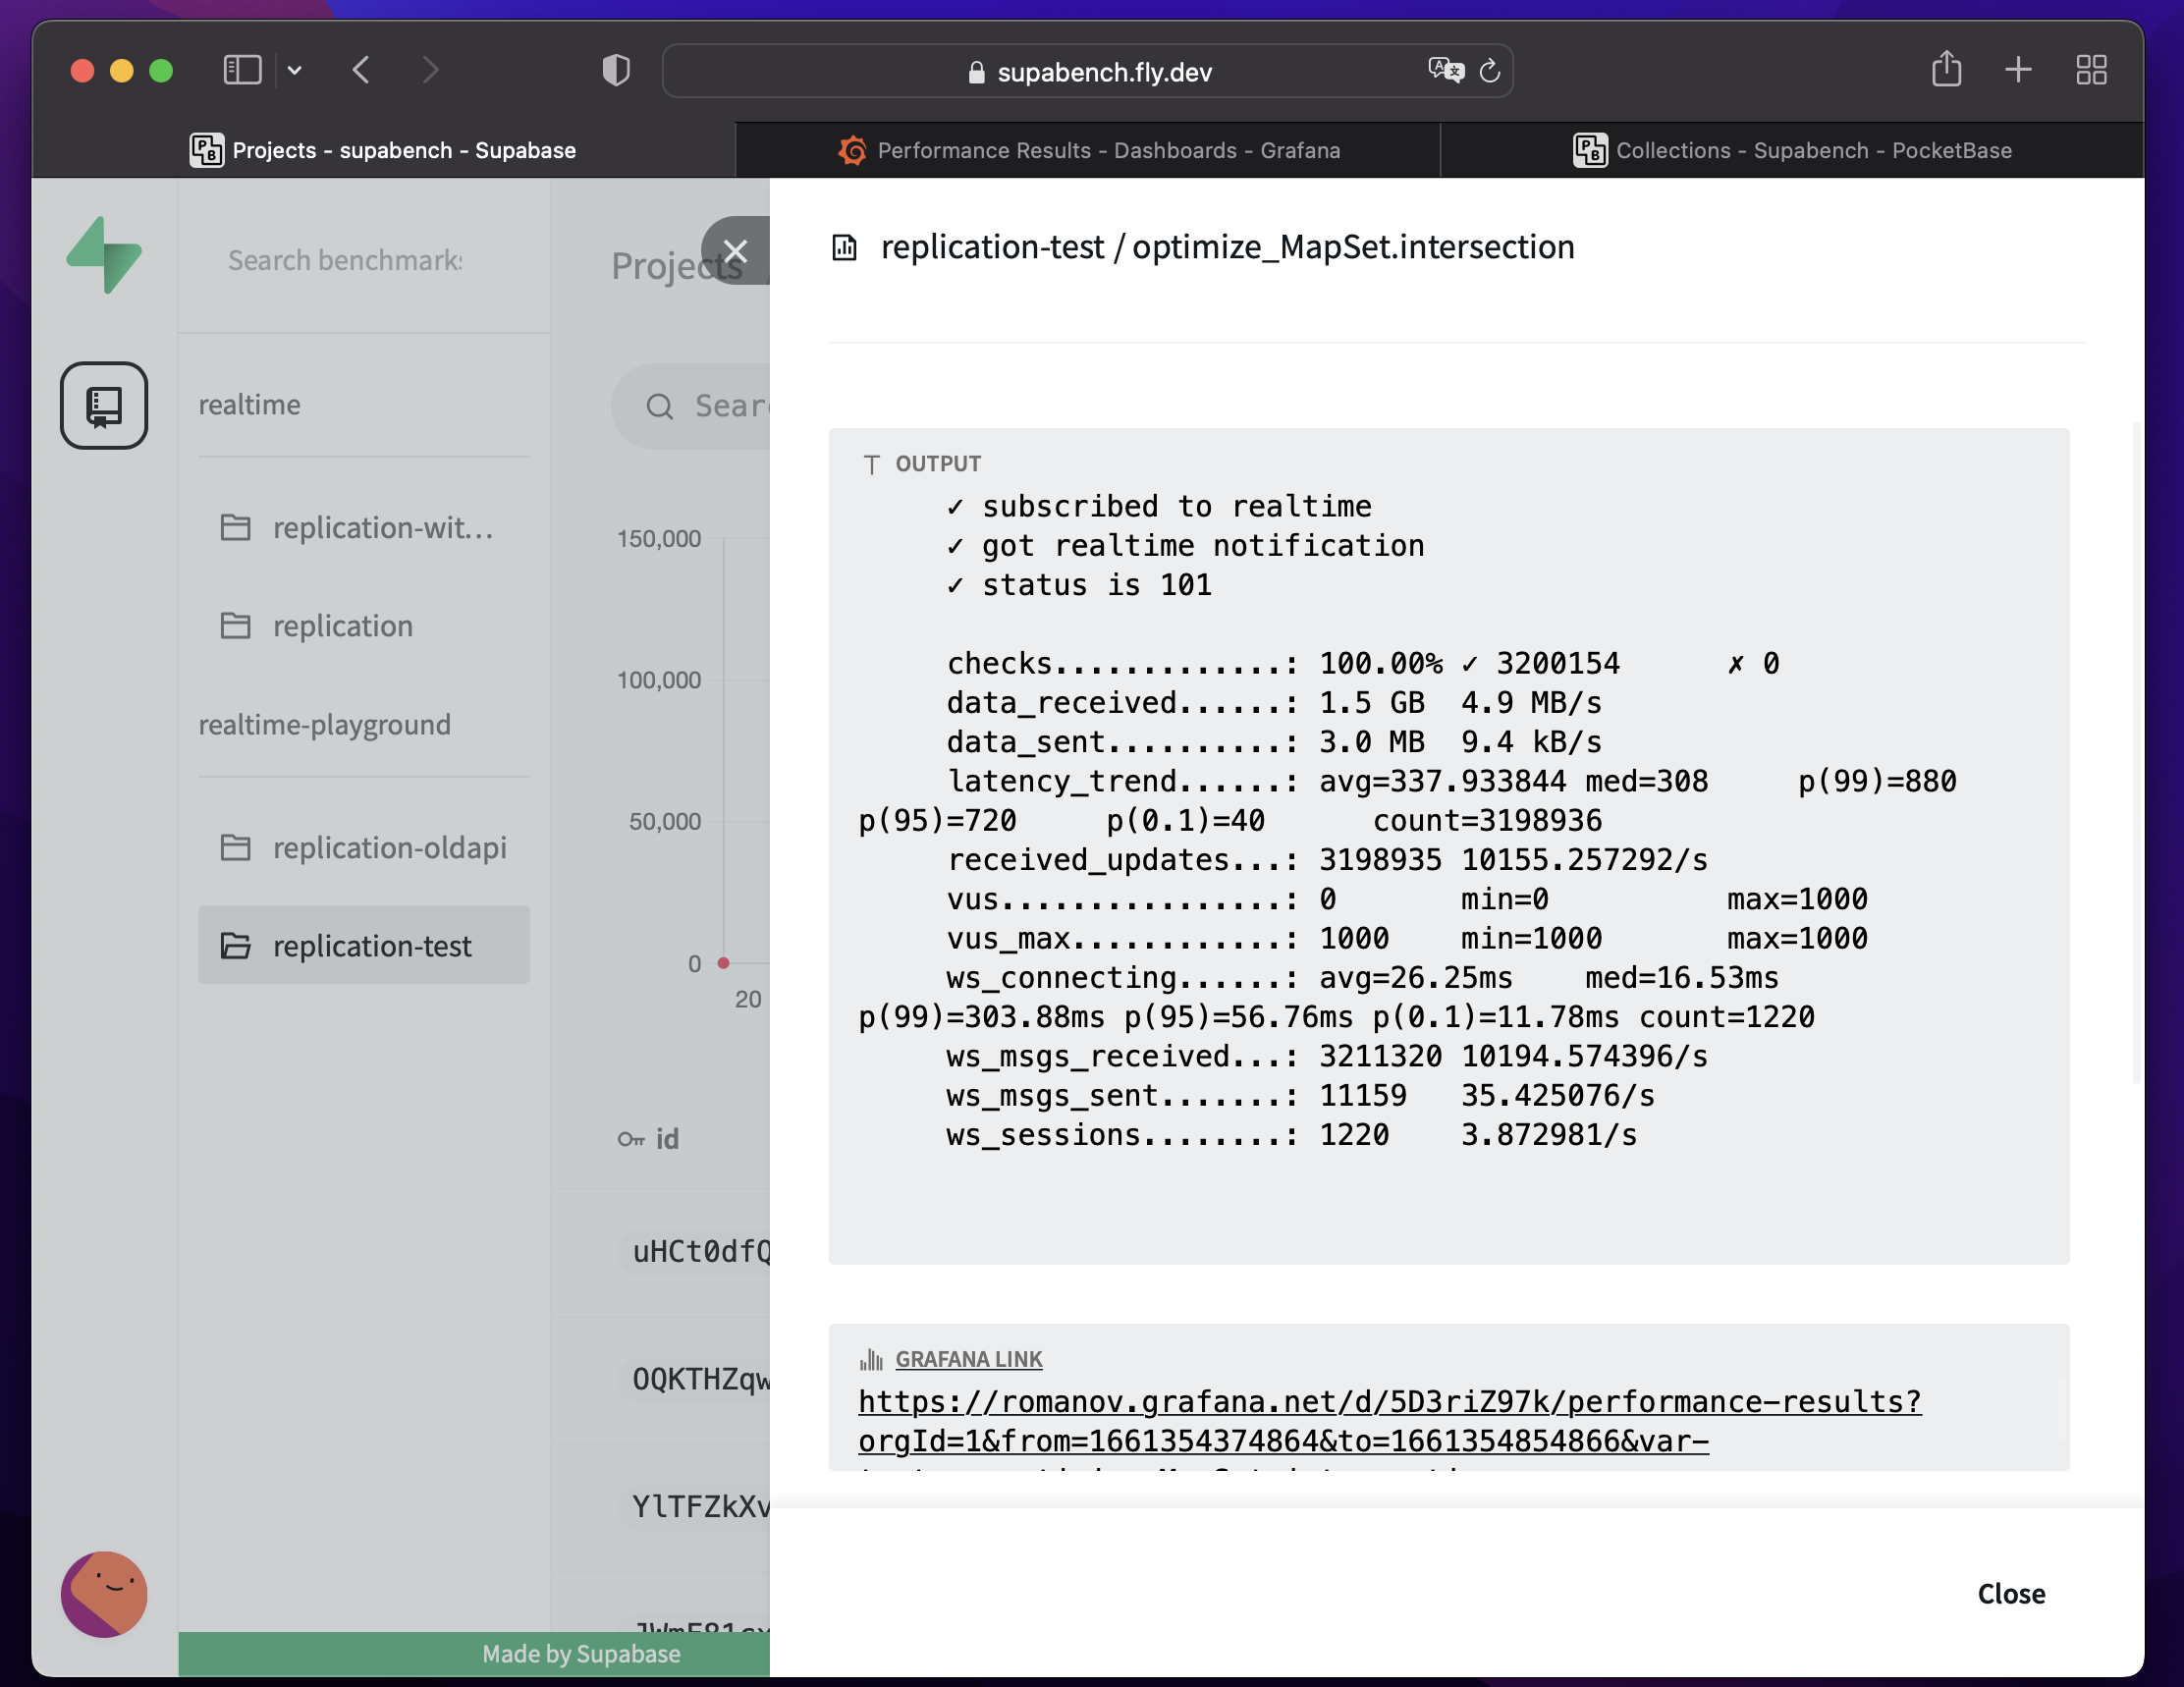
K6 exports some metrics by default, for HTTP request duration, status code, and throughput in bytes, WS connecting duration and so on. You can find it by looking into the summary report after your run is finished. VUs is also one of those metrics.
It is good to know what is happening with your loader instance during the test execution. We don't want to load test the load generator itself right?) We may use telegraf to send some metrics of the host it is running on, which is very useful for us.
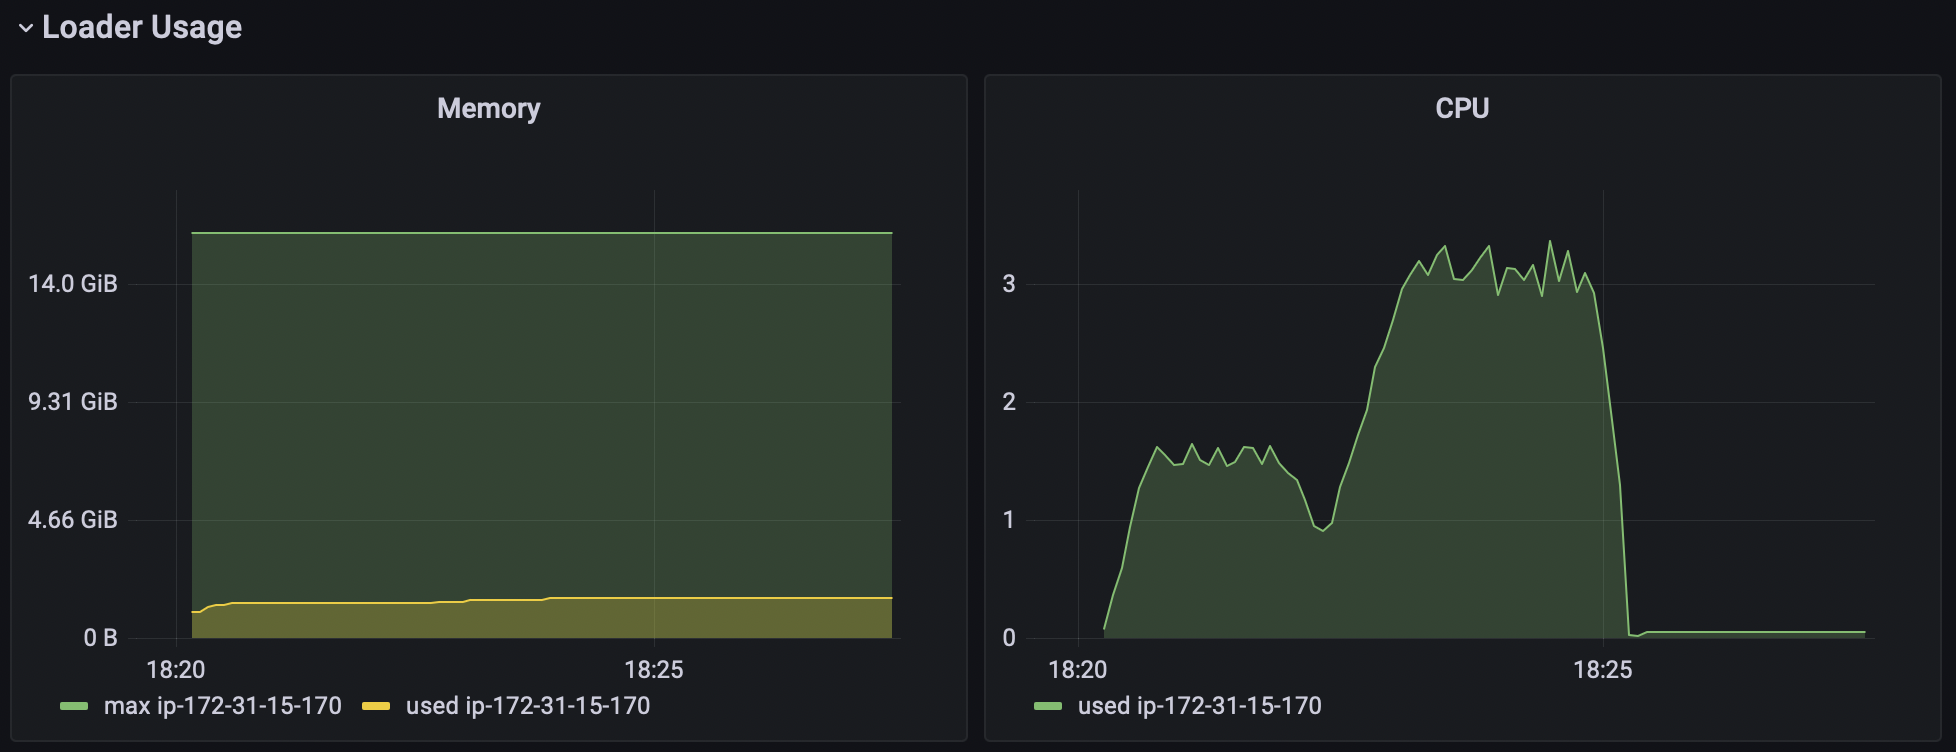
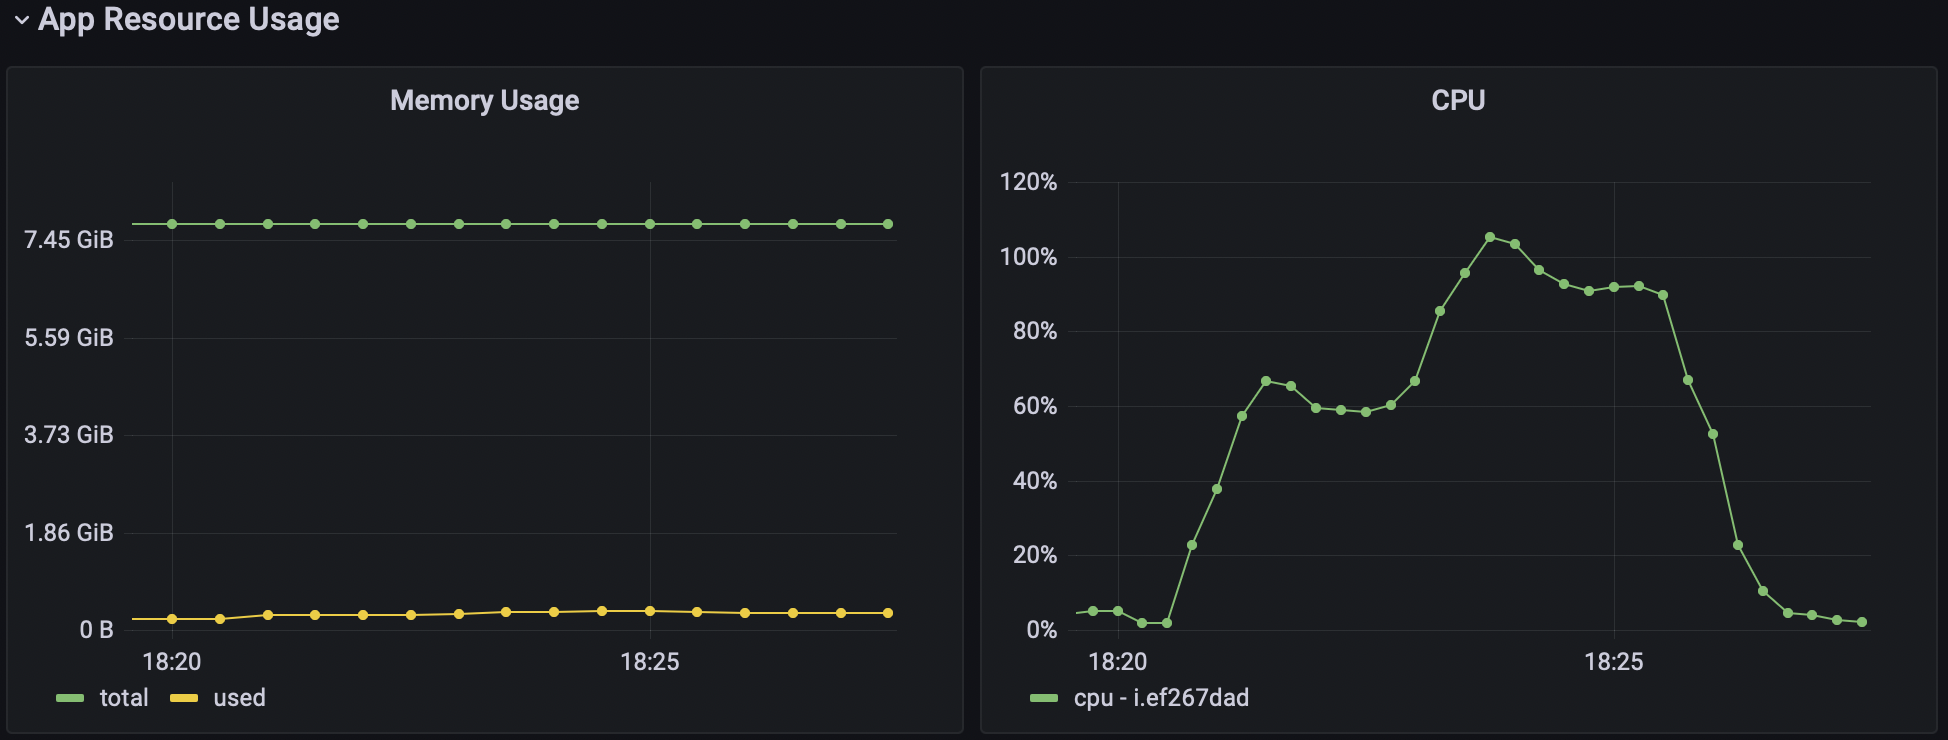
Last but not least, we should get some metrics of the SUT. For example, CPU, memory usage, network usage, and so on. Because we not only want our custom metrics to satisfy our needs, but also to understand that the SUT is not degrading as we add new features or do some refactoring.
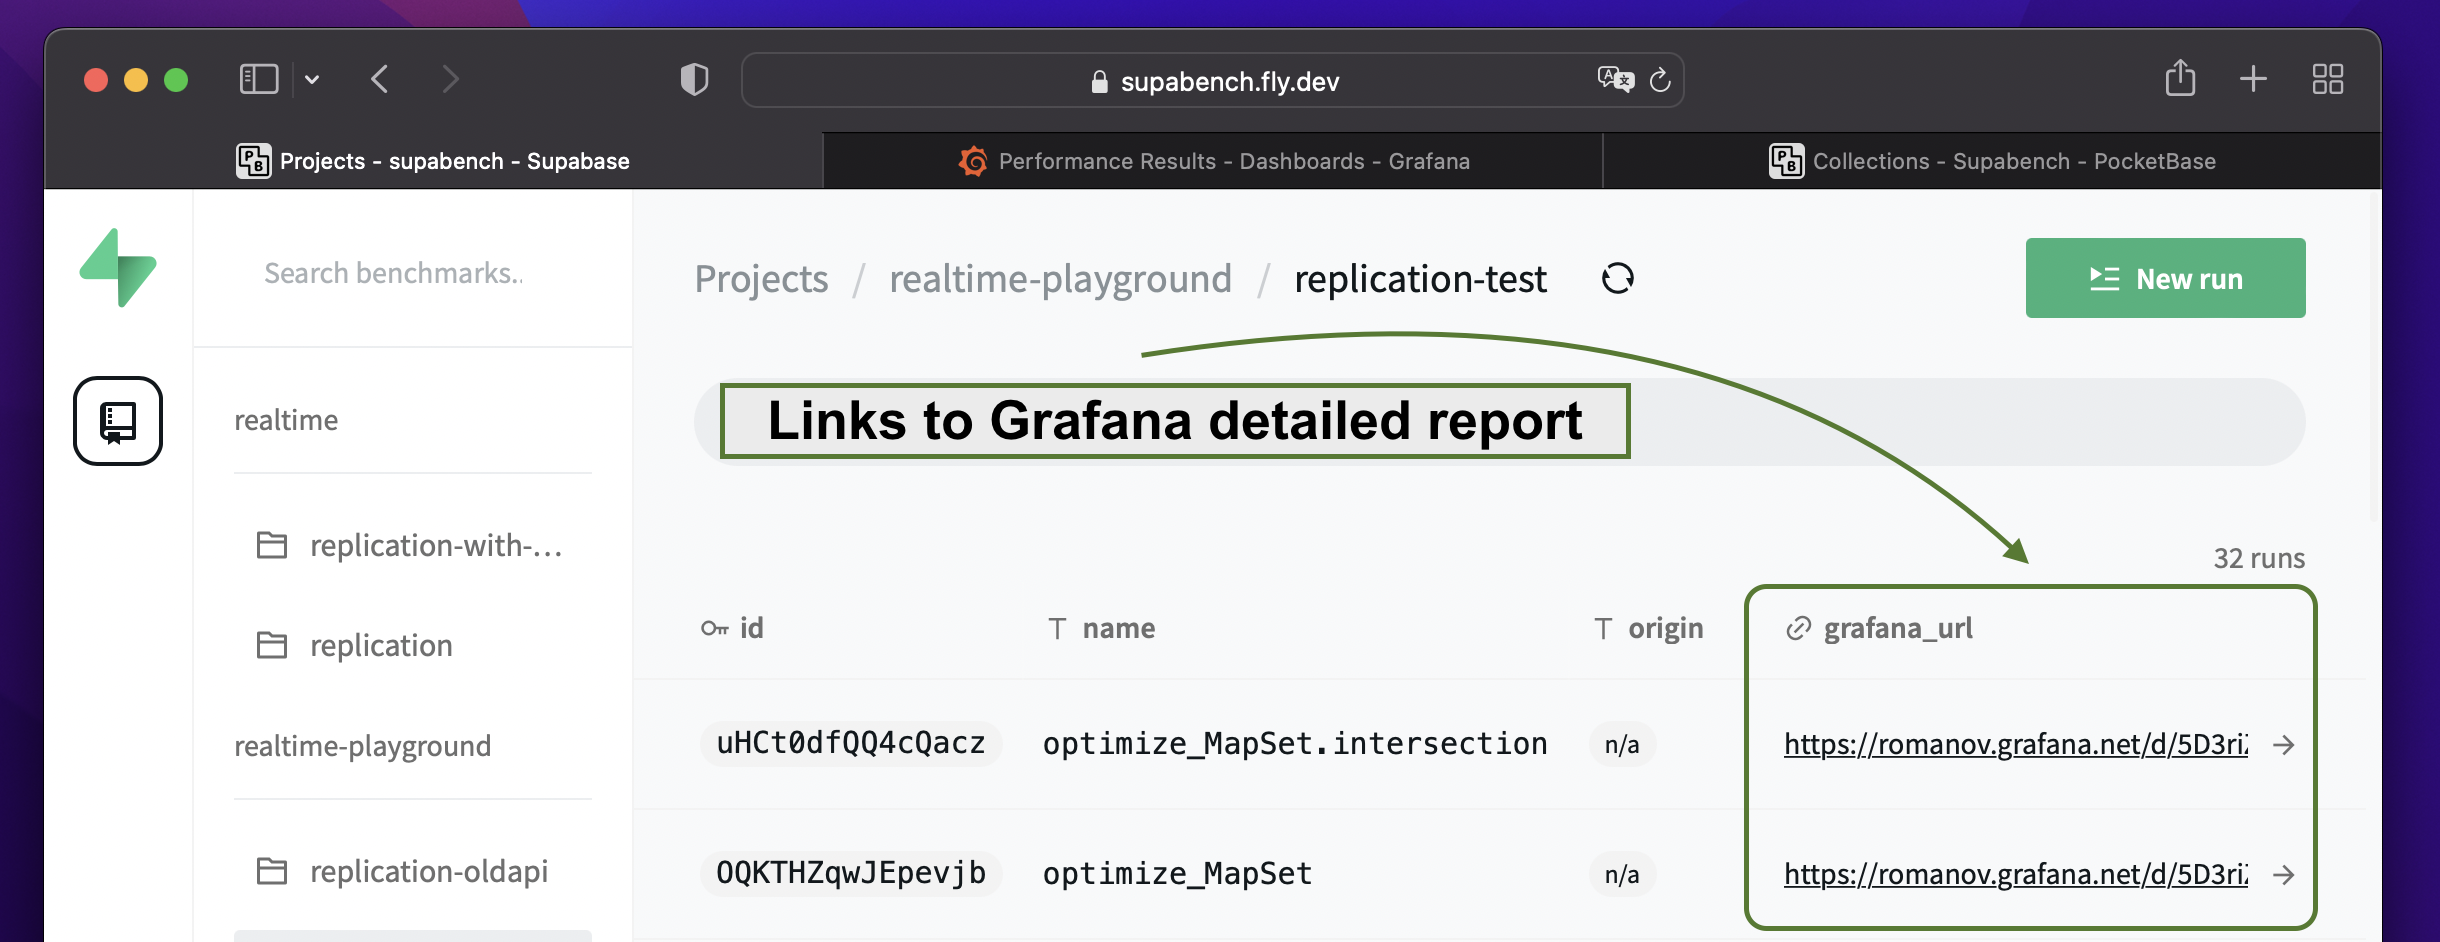
When you are creating a benchmark, you can specify the base URL for the grafana dashboard. If you do so, Supabench will automatically add time range to the link and test run name as a dashboard variable in the Benchmark Runs view. So, you can easily jump to the grafana and analyze the benchmark run results.
In addition to that, if the benchmark run will be completed successfully, the default k6 summary report will be added to the Supabench UI. To access it just click on the Run row in the Benchmark Runs table.
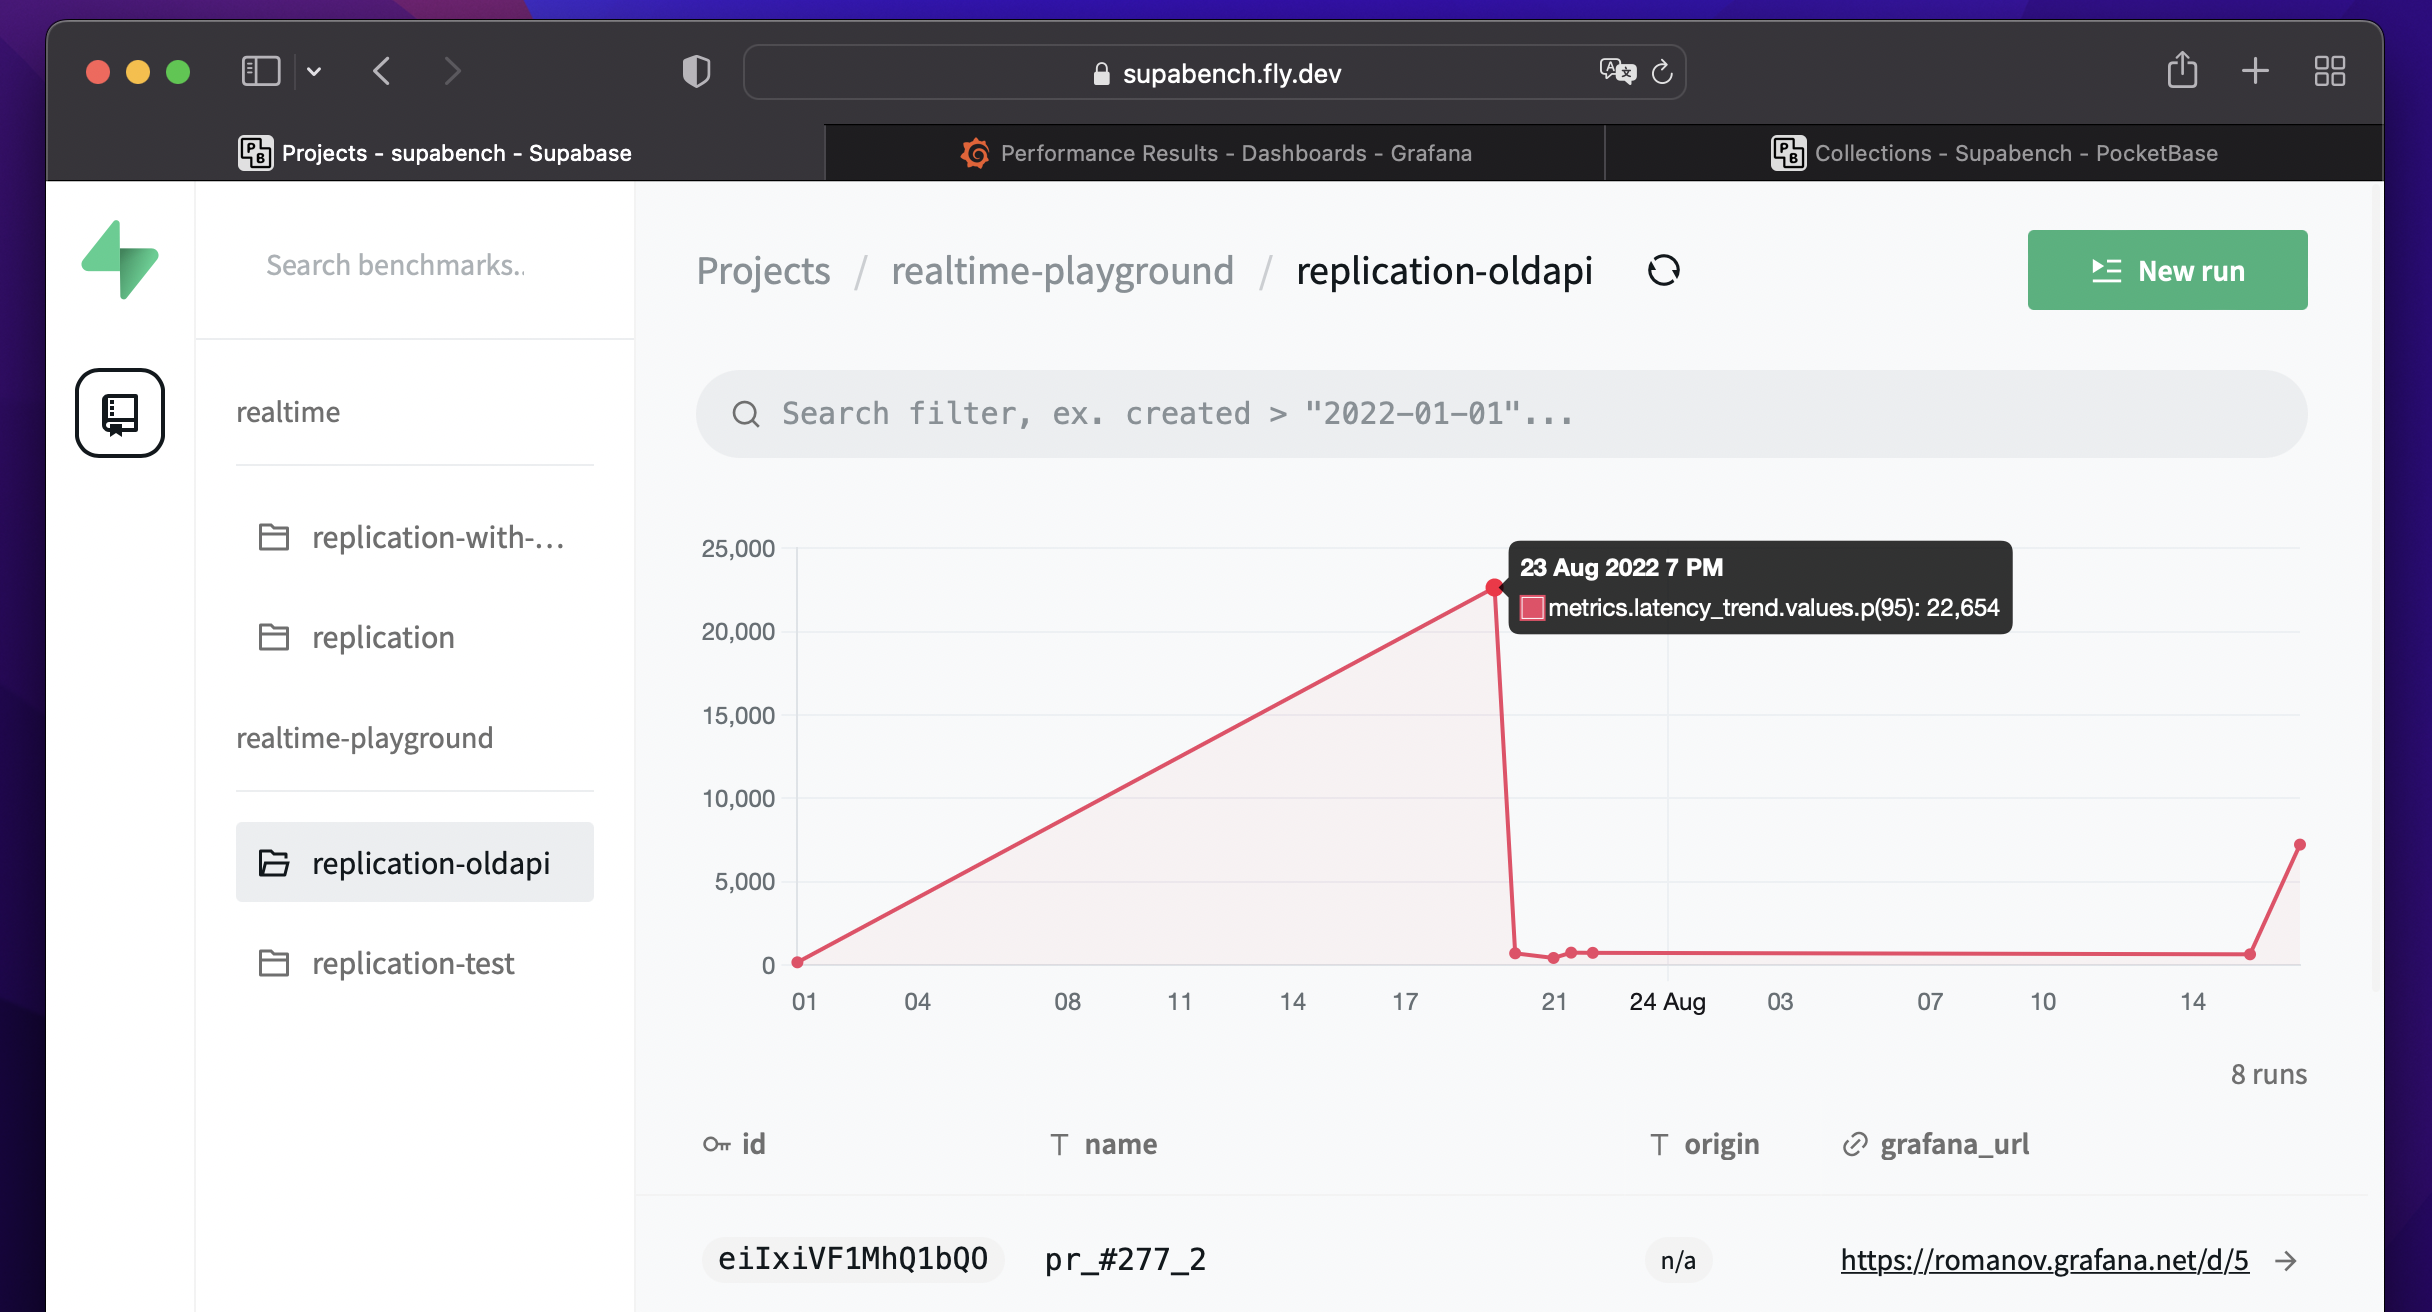
If you specify extract metric path in the benchmark, Supabench will use it to extract one metric from the k6 JSON report to create a chart for this metric change through the history of runs.
If you have any issues understanding the terms, you may refer to Terminology.