


A Simple Debugging tool for Atom. xatom-debug is a base debugger UI provider, you will need additionally install a specific debugger for your language.
apm install xatom-debug
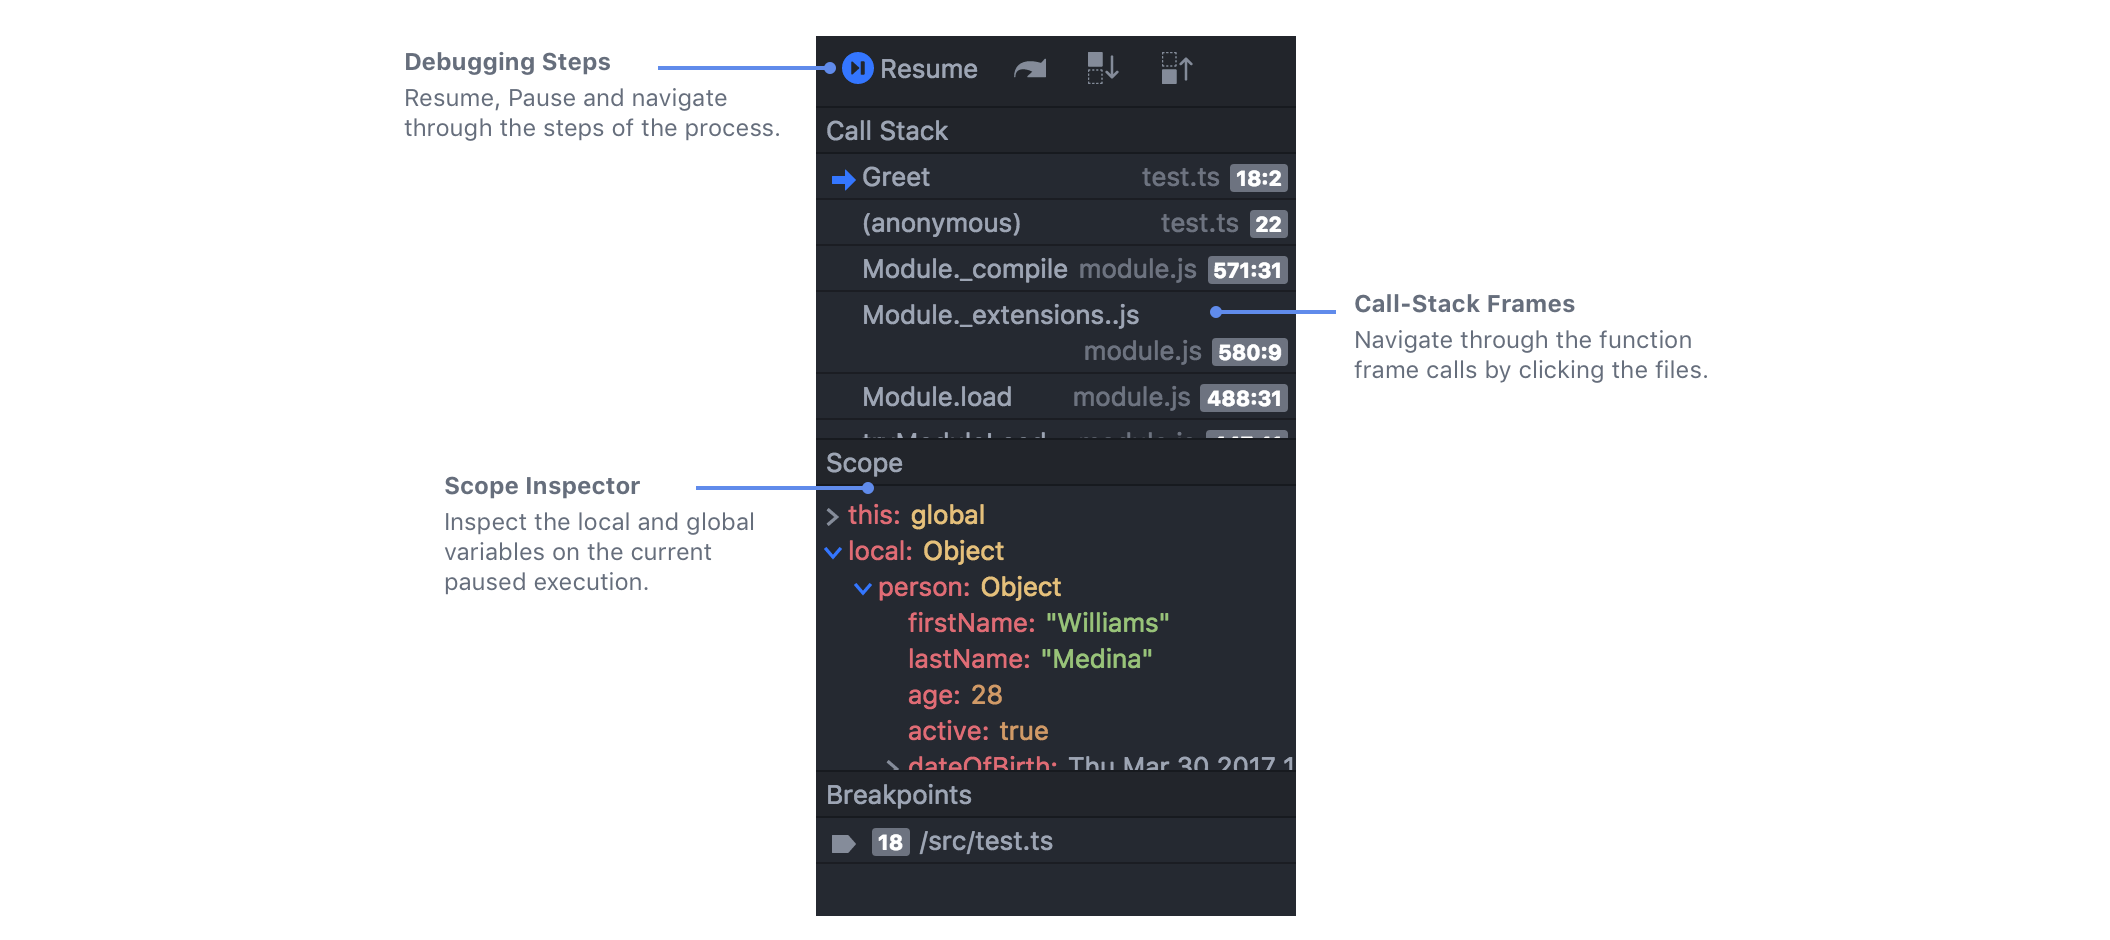
Toolbar: Toolbar API allows to control the execution process, select and configure the selected plugin.

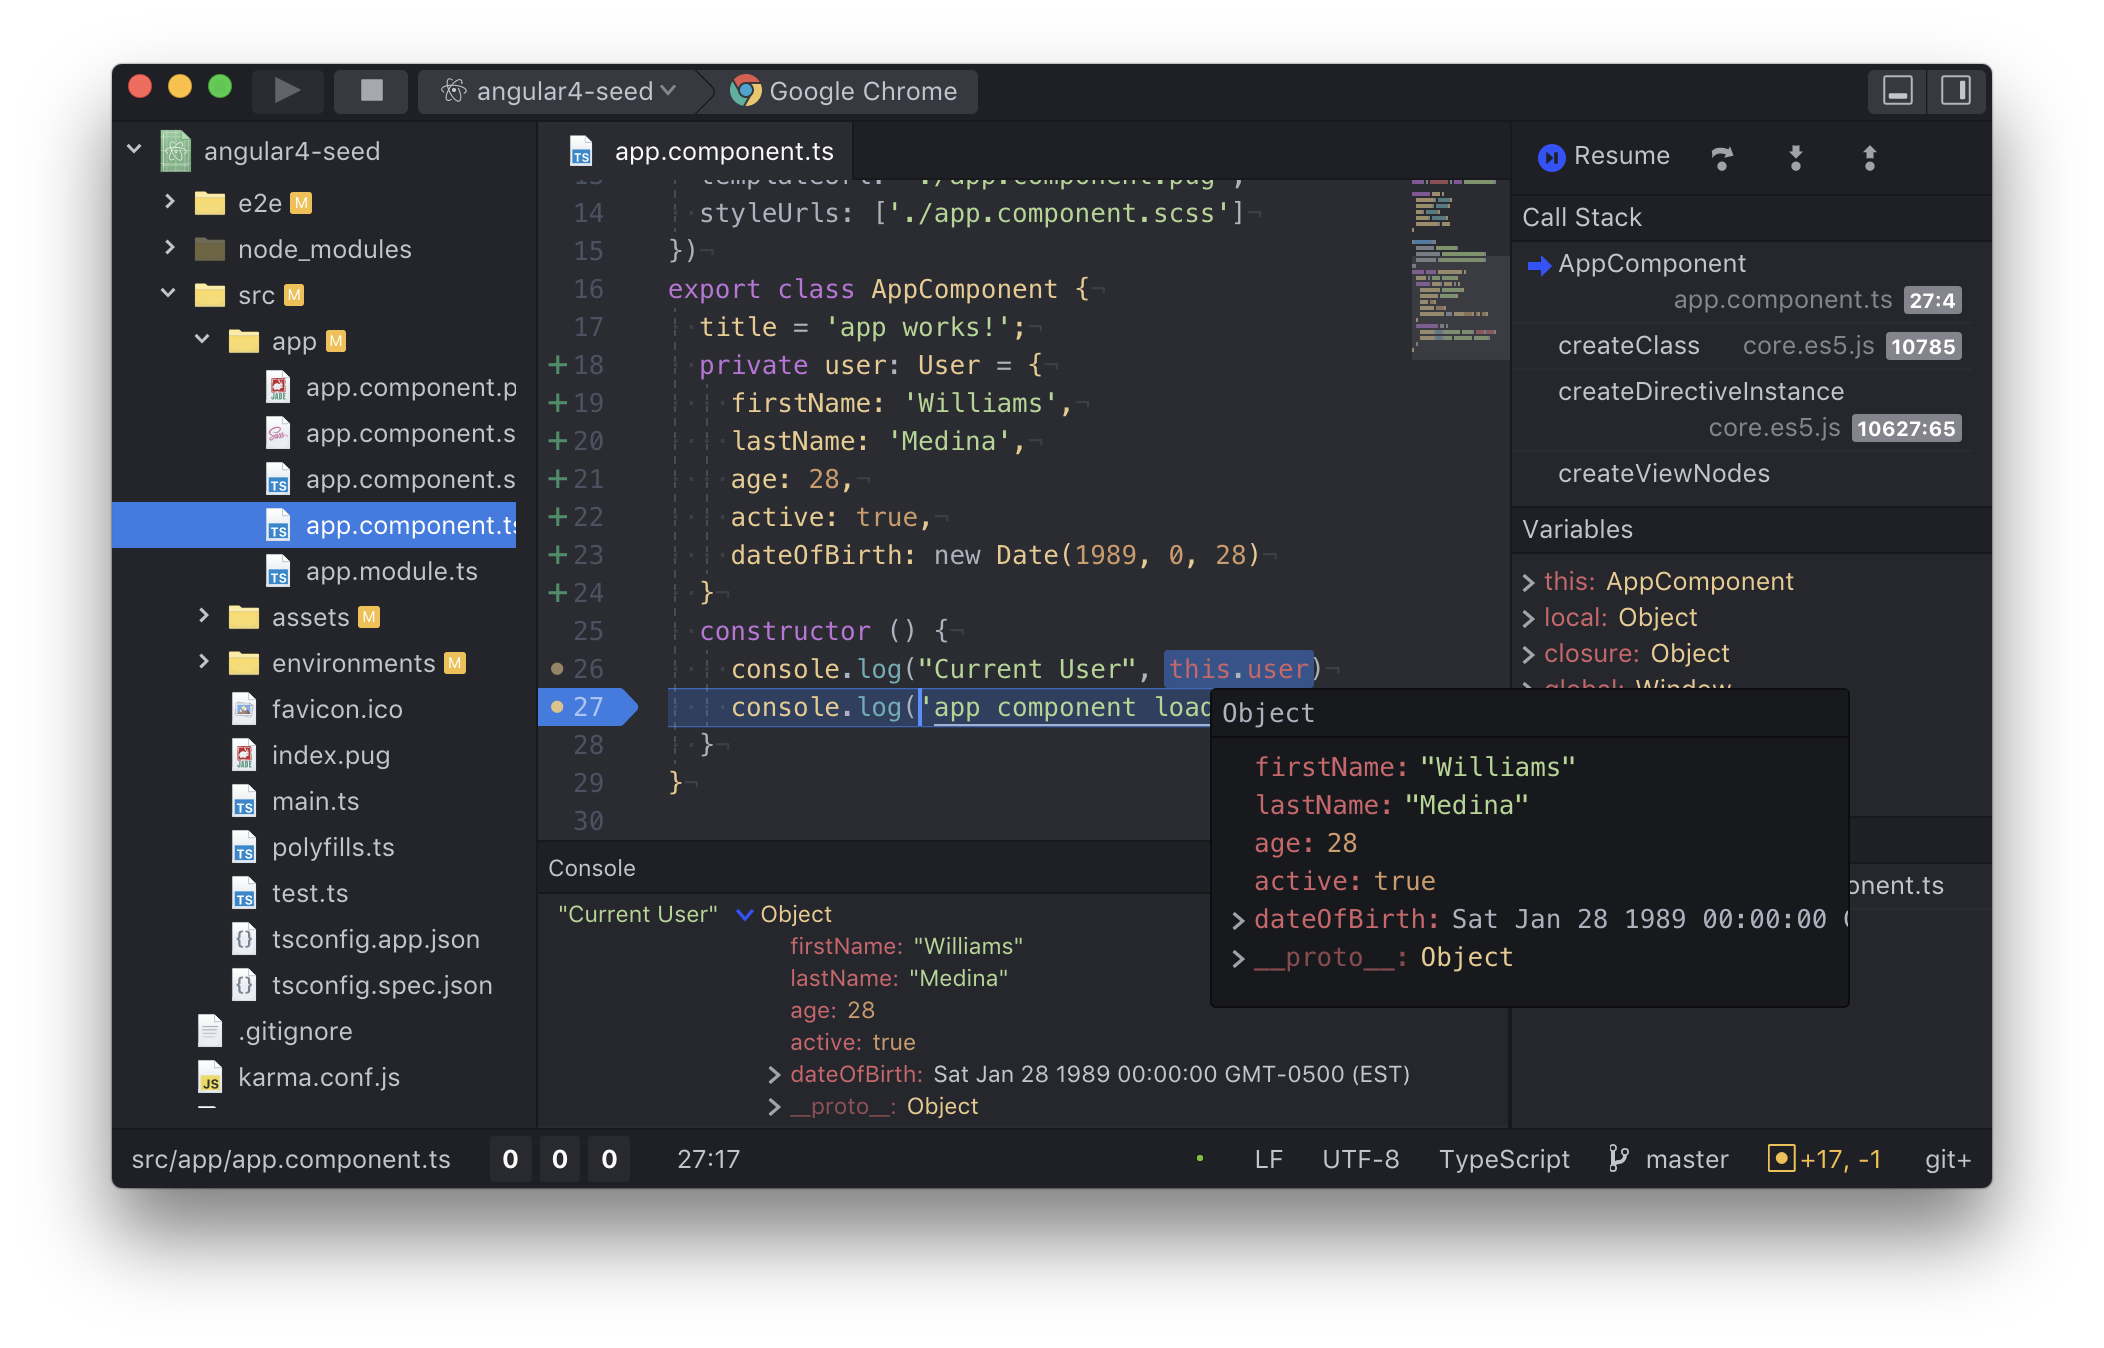
Breakpoints: Add, remove breakpoints by clicking on the file line. breakpoints are accessible from theDebug Areaas well.

Debug Area: Navigate the current scope status local and global variables, open the current call-stack functions and control the execution step.
Configuration:
on progress...
Below is the list of available plugins so far:
| Package | Description |
|---|---|
| NodeJS | Run and debug javascript files using NodeJS 6.3+. |
| Google Chrome | Connect the debugger to a server enabling debugging javascript files. |
- atom 1.0.0+
MIT