0. Prerequisites
- Ensure you have Node.js version 16 or higher installed.
- Create a a Mapbox access token
- Create a
.envfile in the root repository and add the required variables:
NX_DATABASE_STORAGE=builtrix_development.sqlite
NX_REACT_APP_MAPBOX_TOKEN=[YOUR_MAPBOX_TOKEN]
1. Clone the repository
git clone <repository-url>
2. Install dependencies
npm install
3. Start the development server
npx nx serve server
4. Seed the database
After you start the server, a builtrix_development.sqlite file will be generated in the root directory of the repository. To populate this SQLite database with data (a process known as "seeding"), follow these steps:
- Download and install DB Browser for SQLite.
- Open DB Browser and click on "Open Database".
- Navigate to the root directory of the repository and select the
builtrix_development.sqlitefile. - Go to File > Import > Table from CSV file.
Note: The order of importing data is important. Start with the metadata table, followed by the smart_meter table, and finally the energy_source_breakdown table.
If you encounter any issues with these steps, first verify that the builtrix_development.sqlite file exists in the root directory and that its name matches the NX_DATABASE_STORAGE value in your .env file. If the problem persists, please contact me. I can provide a pre-populated database file that you can simply replace in the root directory.
5. Start the client
npx nx serve client
- Nx Monorepo for its streamlined monorepo management, facilitating efficient code sharing and scalable architecture.
- Typescript for enhancing code reliability and developer productivity.
- Sqlite for its simplicity and ease of setup for development purposes.
- Material UI for its easy-to-customize components, which speed up UI development and keep the design consistent.
- Mapbox for providing interactive maps and location features as suggested.
- Mui Charts for creating consistent, easy-to-use charts, leveraging the existing use of Material-UI in the project.
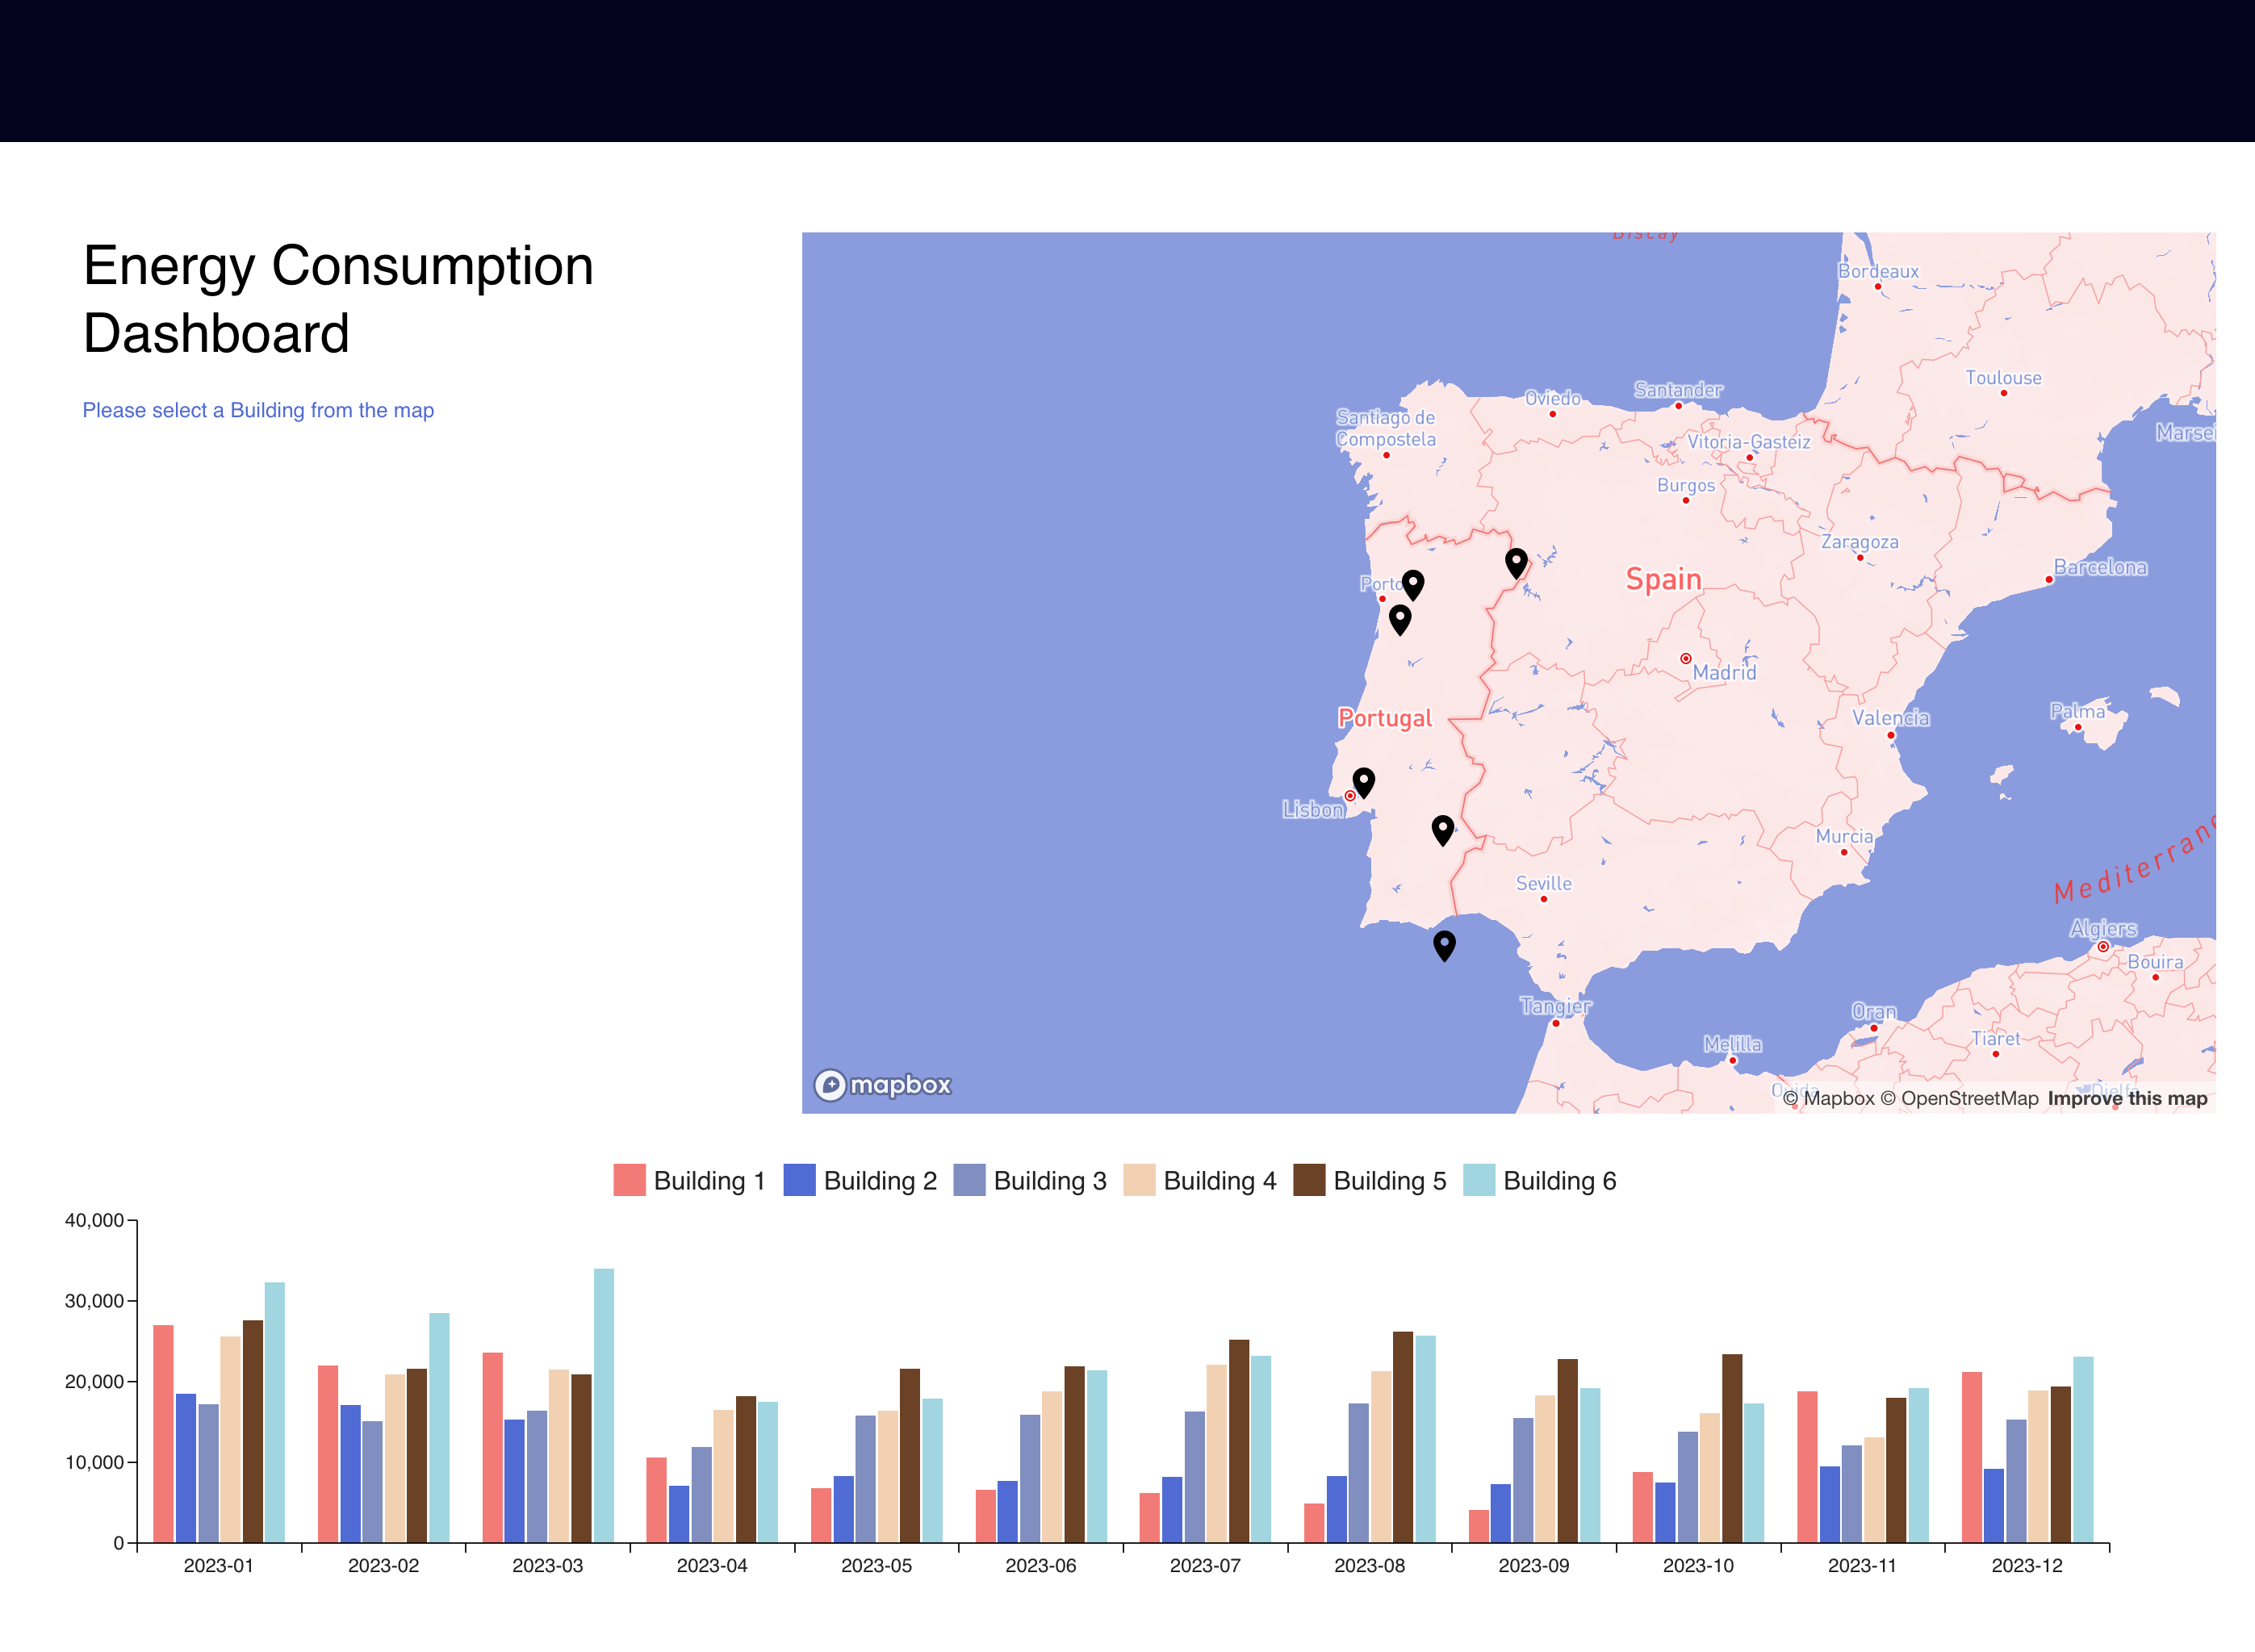
- Building clickable geo-location on map
- Aggregated data of energy consumption
- Energy Source Breakdown (pie chart): Couldn't reach the development on time
- Implement a simple authentication system: Couldn't reach the development on time but I could share previous projects in which I implemented authentications systems
- Filter
- Hover for metadata
- Complete the required development
- Add selected building to the url to make the selection sharable
- Better implement queries to save the filter data from the selected buildings
- Error handling