G2 is a visualization grammar for dashboard building, data exploration and storytelling.
This project was created to allow us to render G2 charts in streamlit. Live Demo.
![]()


pip install streamlit-g2
import streamlit as st
from streamlit_g2 import g2

options = {
    "type": "interval",
    "data": [
        { "genre": 'Sports', "sold": 275 },
        { "genre": 'Strategy', "sold": 115 },
        { "genre": 'Action', "sold": 120 },
        { "genre": 'Shooter', "sold": 350 },
        { "genre": 'Other', "sold": 150 },
    ],
    "encode": {
        "x": "genre",
        "y": "sold",
        "color": "genre",
    }
}

g2(options=options, style=None)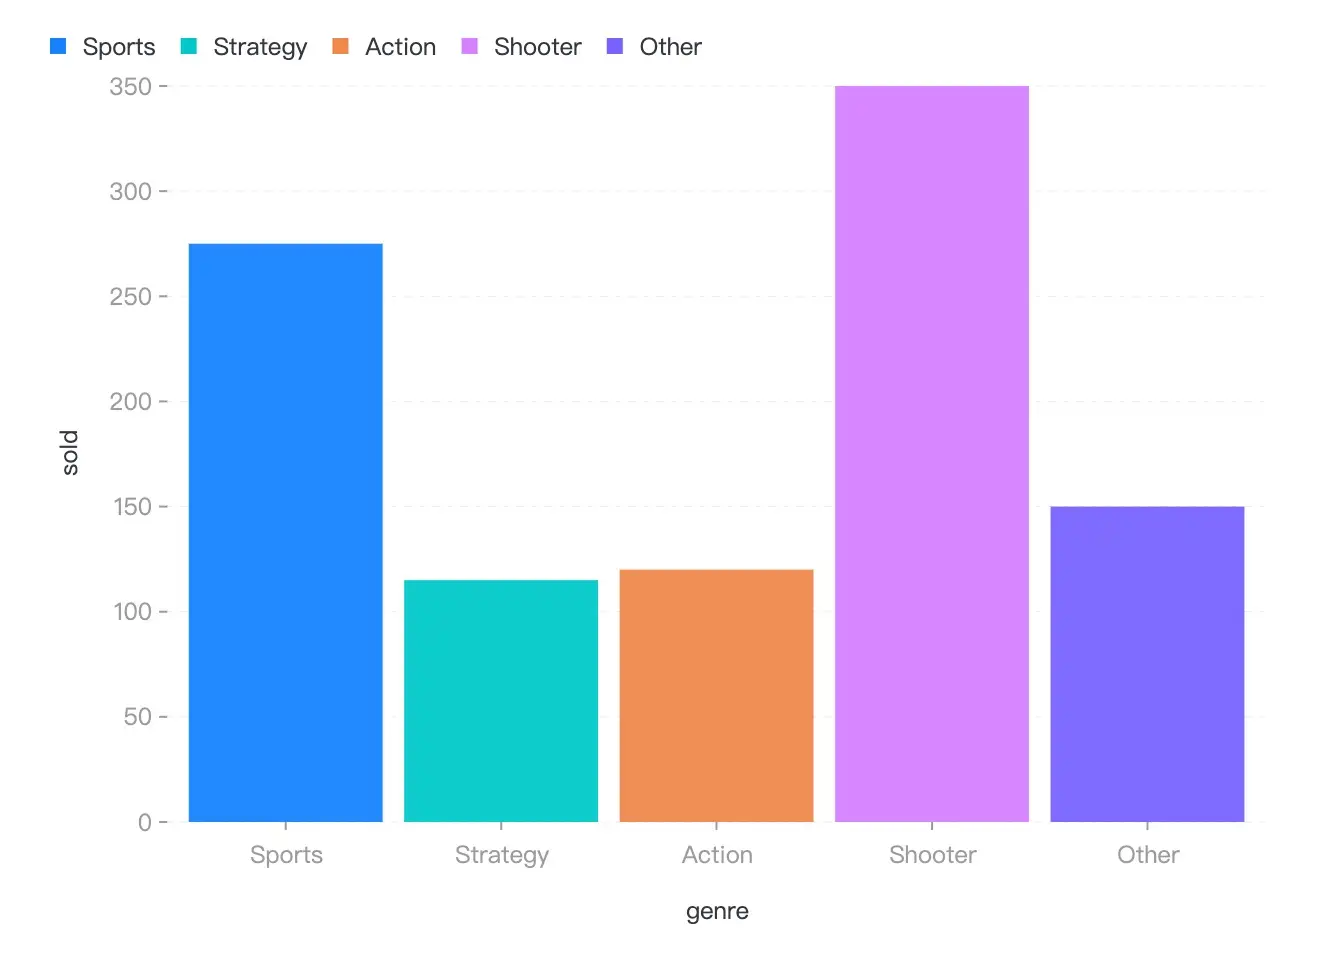
Now, There is only one API for streamlit-g2, named g2, see the options in G2 Spec API.
| Property | Description | Type | Default |
|---|---|---|---|
| options | the options for the visualization, say chart.options(options) |
G2options | null |
- |
| style | the style of the container | CSSProperties |
- |
- How to use Javascript callback function?
import streamlit as st
from streamlit_g2 import g2, JS

options = {
    "type": "interval",
    "data": [
        { "genre": 'Sports', "sold": 275 },
        { "genre": 'Strategy', "sold": 115 },
        { "genre": 'Action', "sold": 120 },
        { "genre": 'Shooter', "sold": 350 },
        { "genre": 'Other', "sold": 150 },
    ],
    "encode": {
        "x": "genre",
        "y": "sold",
        # Use Javascript function.
        "color": JS('''(d) => d.sold > 300 ? "red" : "green"'''),
    }
}

g2(options=option)- Building frontend code by running
npm run startin foldstreamlit_g2/frontend. - Run the example by running
streamlit run streamlit_g2/__init__.pywith_RELEASE = False.
MIT@hustcc.