

Hi, I'm a Senior Software Engineer working at CRSP Center for Research in Security Prices. I'm a member of the Market Indexes Software Development team responsible for the systems that produce the data that backs legendary securities like MGC and VTI. I just completed my first year at CRSP and have been shifting gears toward everything data and finance data. Previous to CRSP I worked at DSI Data Science Institute allocated to the Internet Equity Initiative (IEI) as a Backend/Data Engineer. I'm fascinated by the decision-making processes and data-driven visualizations, finance, and product design. I'm known for my previous experience with computer networks leading the full-stack work of https://beadchallenge.org and Netrics.
Instead of a wordy cv/resume, here's a more relaxed collage of images with important documentation of my work as most of it is open source. Disclaimer: some conclusions here are my own.

Figure 1. This is the Netrics backend stack I was responsible for on the left. In prod for 3 years and crossed the 1 billion data-point mark of encrypted data. The stack includes small Golang data collection applications, python and terraform IaC, SQL database, parallel Python data ingestion, Kafka producer/consumers. On the right, is the System Design for https://beadchallenge.org.

Figure 2. Aggregated average latency (active unloaded ICMP) for all Netrics deployed devices in Chicago city. As expected: fiber tech has lower latency compared to the other technologies. Data warehoused on TimescaleDB, image extracted from Superset BI tool. Estimated devices deployed: 120 in Chicago area. We benchmark the internet for ISPs to ensure internet consumers are getting a fair performance from their contracted services and understand any significant differences between regions that are considered to be antagonistic from their socio-economic characteristics.

Figure 3. A Netrics Grafana dashboard with fluctuation on both latency and speed test. Hypothesis to be investigated: fluctuations like this are unperceived by internet users, but they might impact high-performance game players.

Figure 4. Campus deployment of Netrics, showing high latency for an outlier (Booth School). Image extracted from Looker Studio.

Figure 5. BEADChallenge.org analytics, where the internet speeds are lower (unserved/underserved) in IL, USA? / Satellite Internet Performance: The key technology responsible for bringing Internet to unserved. (Download / Upload in Mbps).

Figure 6. Data analysis work for the Internet Equity Initiative group. Does the low-income population have worse internet performance than the high-income? What does it mean to be an underserved or unserved area regarding broadband infrastructure? Is the broadband evolving in the US (2019 - 2021 comparison)?
Video 1. First prototype of Netrics Passive in action (aka NetMicroscope). Software implemented in C with libwebsockets, libpcap, html, javascript, jquery, chartjs.
[WSJ Study](https://www.wsj.com/graphics/faster-internet-not-worth-it/)
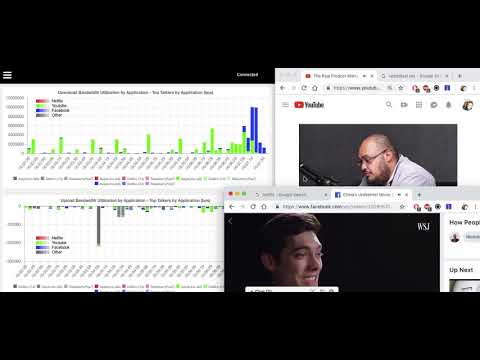


Figure 7. Netrics Passive Schematics developed circa 2015. A $200 kit (Jetson Nano 472 GFLOPS) for high-performance passive packet capture, network monitoring and ML inference.

Figure 8. My earlier work (circa 2009-2011) on Deep Packet Inspection (DPI) for Alcatel-Lucent, programming CloudShield/IBM equipment (PacketC / C ). I was the principal engineer for the protocol/app service detection intelligence of the network traffic control engine called Agya. The solution was deployed in the Latin America region, mainly in Brazil.
 |
 |
 |
 |
 |
 |