Sometimes when building FastHTML apps we run into performance bottlenecks. Figuring out what is slow can be challenging, especially when building apps with async components. That’s where profiling tools like pyinstrument can help. Profilers are tools that show exactly how long each component of a project takes to run. Identifying slow parts of an app is the first step in figuring out how to make things run faster.
Install from PyPI:
pip install fh-pyinstrumentThe easiest way is to import the ProfileMiddleware into your project and
add it to your app’s list of Middleware via the app.add_middleware()
method:
from fasthtml.common import *
from fh_pyinstrument import ProfileMiddleware

app, rt = fast_app()
app.add_middleware(ProfileMiddleware, save_dir='/tmp/profiles')

@rt
def index(): return Titled('Hello, profiler!')

serve()
If you want to add it to the project when fast_app() is declared,
you’ll need to run it through Starlette’s middleware pre-processor:
from starlette.middleware import Middleware

app, rt = fast_app(middleware=(Middleware(ProfileMiddleware)))

@rt
def index(): return Titled('Hello, profiler!')

serve()
If you want to change the querypath trigger key from profile to
something else, set the desired value to PYINSTRUMENT_TRIGGER.
export PYINSTRUMENT_TRIGGER=instrumentNow this will trigger the report:
https://localhost:5001/?instrument=1
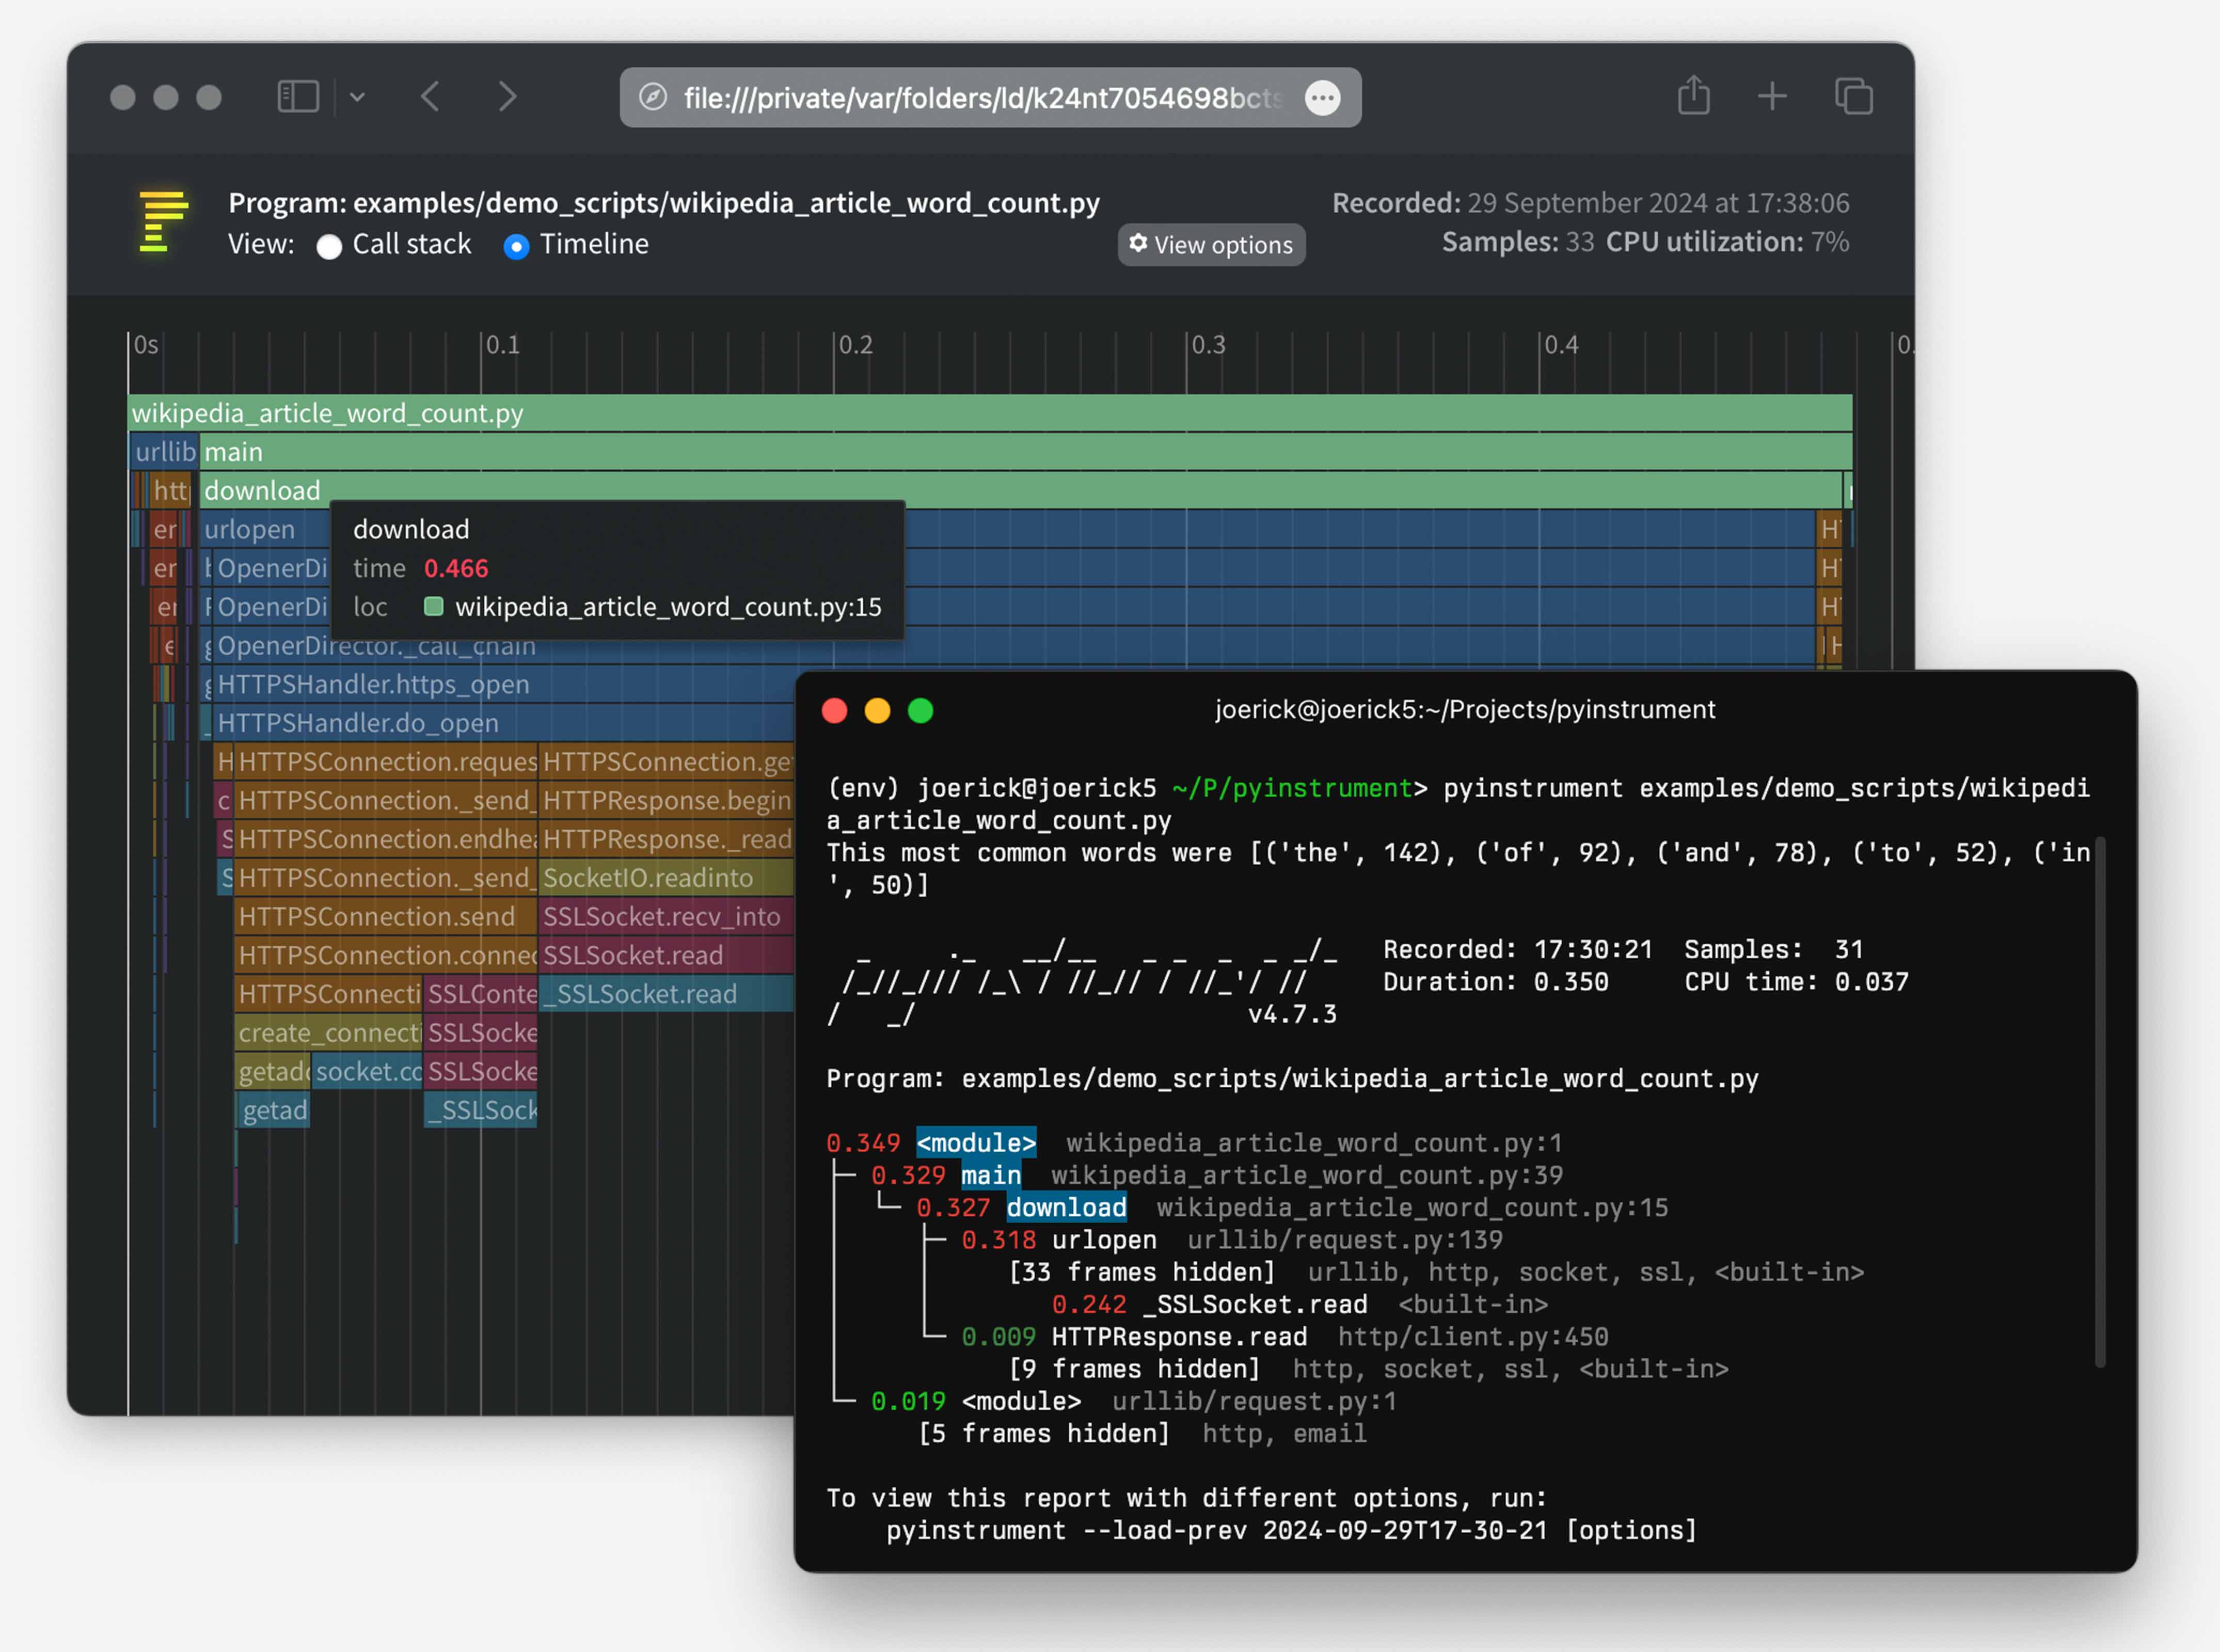
Simply add ?profile=1 to any url, that will cause the app to display
an amazing chart set in the browser. In the example above, run it and
click this link:
http://127.0.0.1:5000/?profile=1
If instead you want to have the results show up in the terminal, also
add term=1 to the query string. The normal web page will display in
your browser, and the pyinstrument view will show up in limited form
within the terminal.
If you want to temporarily use fh-pyinstrument on an isolated route
handler, the @instrument decorator can be used. This triggers on any
call to the affected route, isn’t triggered by the `?profile=1” query
value.
from fh_pyinstrument import instrument

@rt
@instrument
def index(): return Titled('Hello, profiler!')Pass save_dir to the middleware to pickle each profiled request’s
session to disk:
app.add_middleware(ProfileMiddleware, save_dir='/tmp/profiles')Each request with ?profile=1 now saves a .pkl file alongside the
HTML view. Load it later for analysis:
from pathlib import Path
from fh_pyinstrument import load_session, render_session

sess = load_session(sorted(Path('/tmp/profiles').glob('*.pkl'))[-1])
print(render_session(sess))
render_session returns console text by default (with
show_all=False, short_mode=True). Pass text=False for HTML output.
Sessions have four analysis methods patched in. All accept an optional
paths list to filter by file path substrings
(e.g. ['myapp/', 'fasthtml/']) and n to limit results.
sess.flat(paths, n) — Which functions have the most self-time?
sess.flat(paths=['myapp/'], n=10)
# [ProfileEntry(time=0.287, func='_to_xml', file='fastcore/xml.py', line=177),
#  ProfileEntry(time=0.115, func='_get_deps', file='myapp/db.py', line=525), ...]
sess.callers(func_name, paths, n) — Who’s calling this hot
function?
sess.callers('ft_html')
# Shows which functions call ft_html and how much time they contribute
sess.callees(func_name, paths, n) — What does a function spend its
time on?
sess.callees('MsgButtons', paths=['myapp/', 'fasthtml/'], n=5)
# Shows the most expensive functions called inside MsgButtons
sess.hot_paths(paths, n, depth) — Most expensive call stacks,
collapsed to matching frames:
for t, s in sess.hot_paths(paths=['myapp/'], n=5):
    print(f'{t*1000:.1f}ms  {s}')
# 245.0ms dialog_ core.py:2236 → chat core.py:2206 → MessageCard cards.py:249 → _to_xml xml.py:177A Session contains a tree of Frame objects. The key attributes on
Frame:
| Attribute | Description |
|---|---|
function |
Function name |
file_path |
Absolute path to source file |
line_no |
Line number |
children |
List of child frames |
time |
Total time including children |
total_self_time |
Time in this function only (excluding children) |
absorbed_time |
Time hidden by pyinstrument’s grouping |
is_application_code |
Whether pyinstrument considers this app code |
Walking the tree manually:
from pyinstrument.session import Session

sess = load_session('profile.pkl')
root = sess.root_frame()
print(f'Duration: {sess.duration:.2f}s')

def walk(frame, depth=0):
    if frame.total_self_time > 0.01:
        print(f'{"  "*depth}{frame.total_self_time*1000:.0f}ms  {frame.function}  {frame.file_path}:{frame.line_no}')
    for c in frame.children: walk(c, depth+1)

walk(root)
You can also render a session directly without going through Profiler:
from pyinstrument.renderers import ConsoleRenderer, HTMLRenderer

print(ConsoleRenderer(show_all=False, short_mode=True).render(sess))