-
Notifications
You must be signed in to change notification settings - Fork 132
Description
Describe the bug
After a while running Jormungandr, CPU usage slowly creeps to 100% at which point the node is unable to keep in sync with the network. The only way to recover is to reset the node.
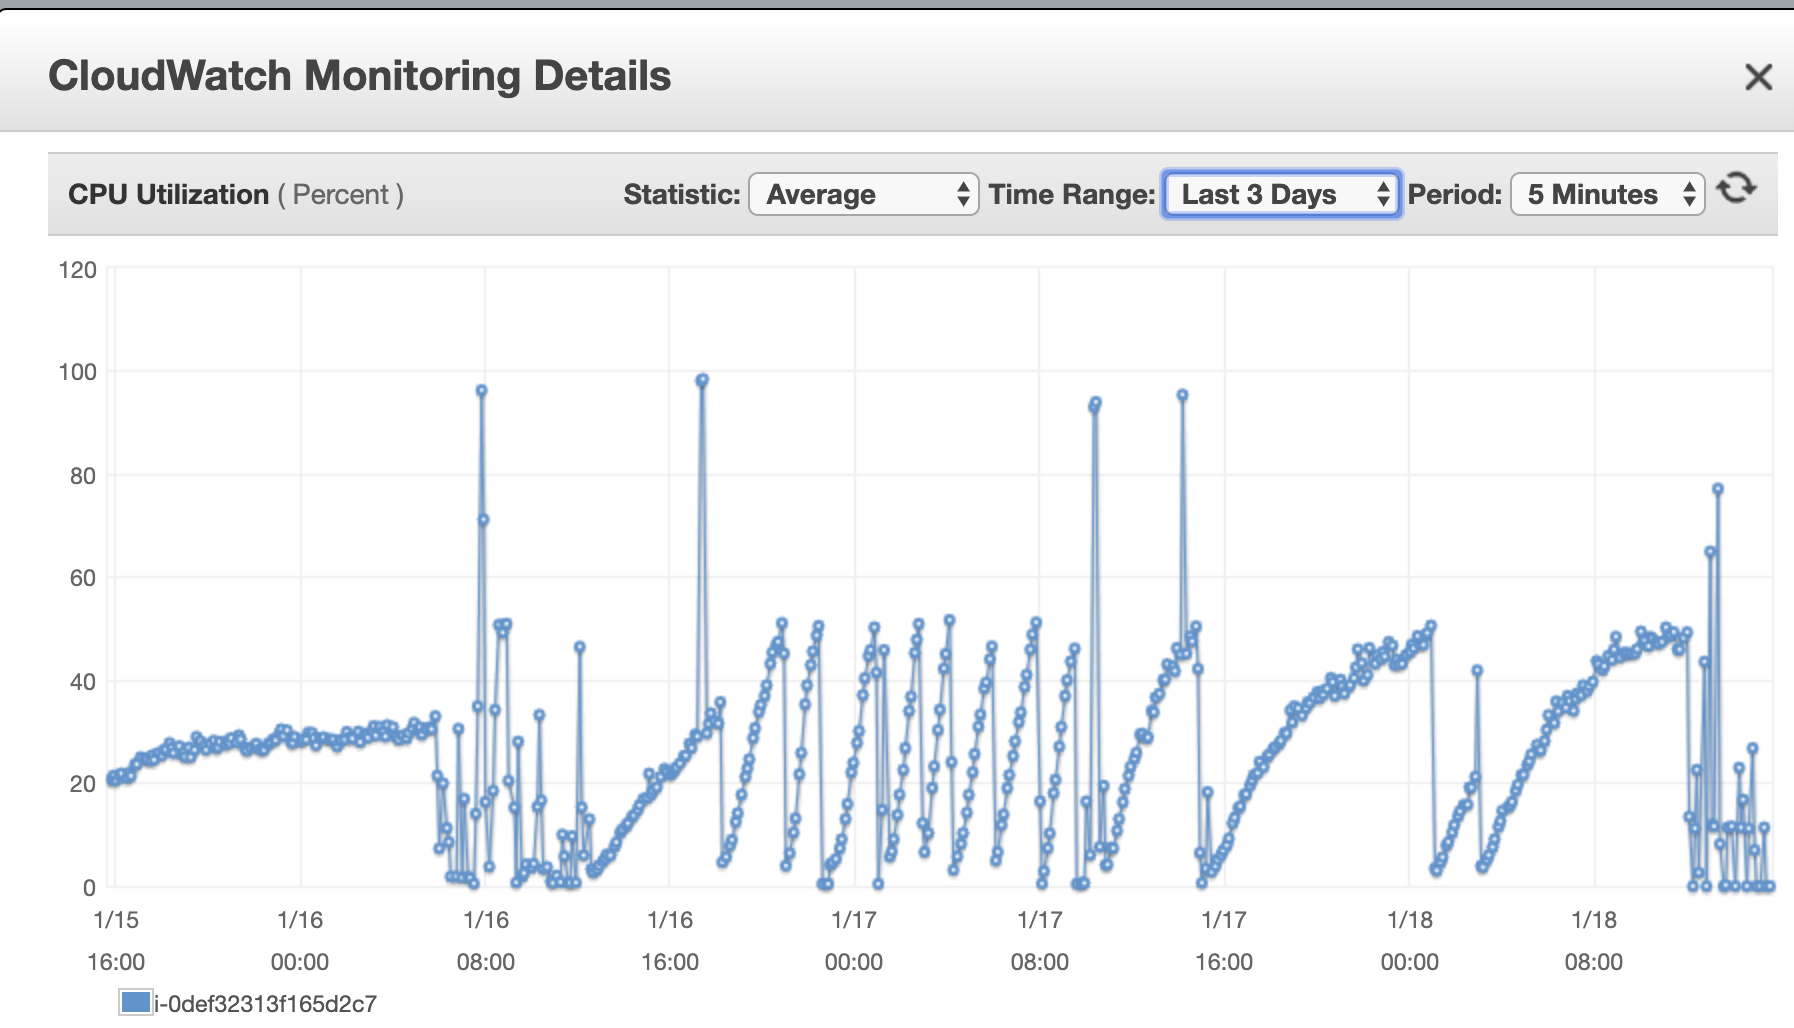
The following diagram illustrates this behaviour:
This is a 2 core node, and 50% CPU utilisation represents and entire core being consumed by Jormungandr (I think because the async thread pool being used is singly threaded in the particular path of code highlighted below).
The sawtooth pattern changes depending on max_connections and gossip period. The period between 16:00 and 08:00 shows a steeper climb to total CPU consumption. Later the climb is not so steep because I have changed max_connections and gossip interval from 512 and 5s to 256 and 10s respectively.
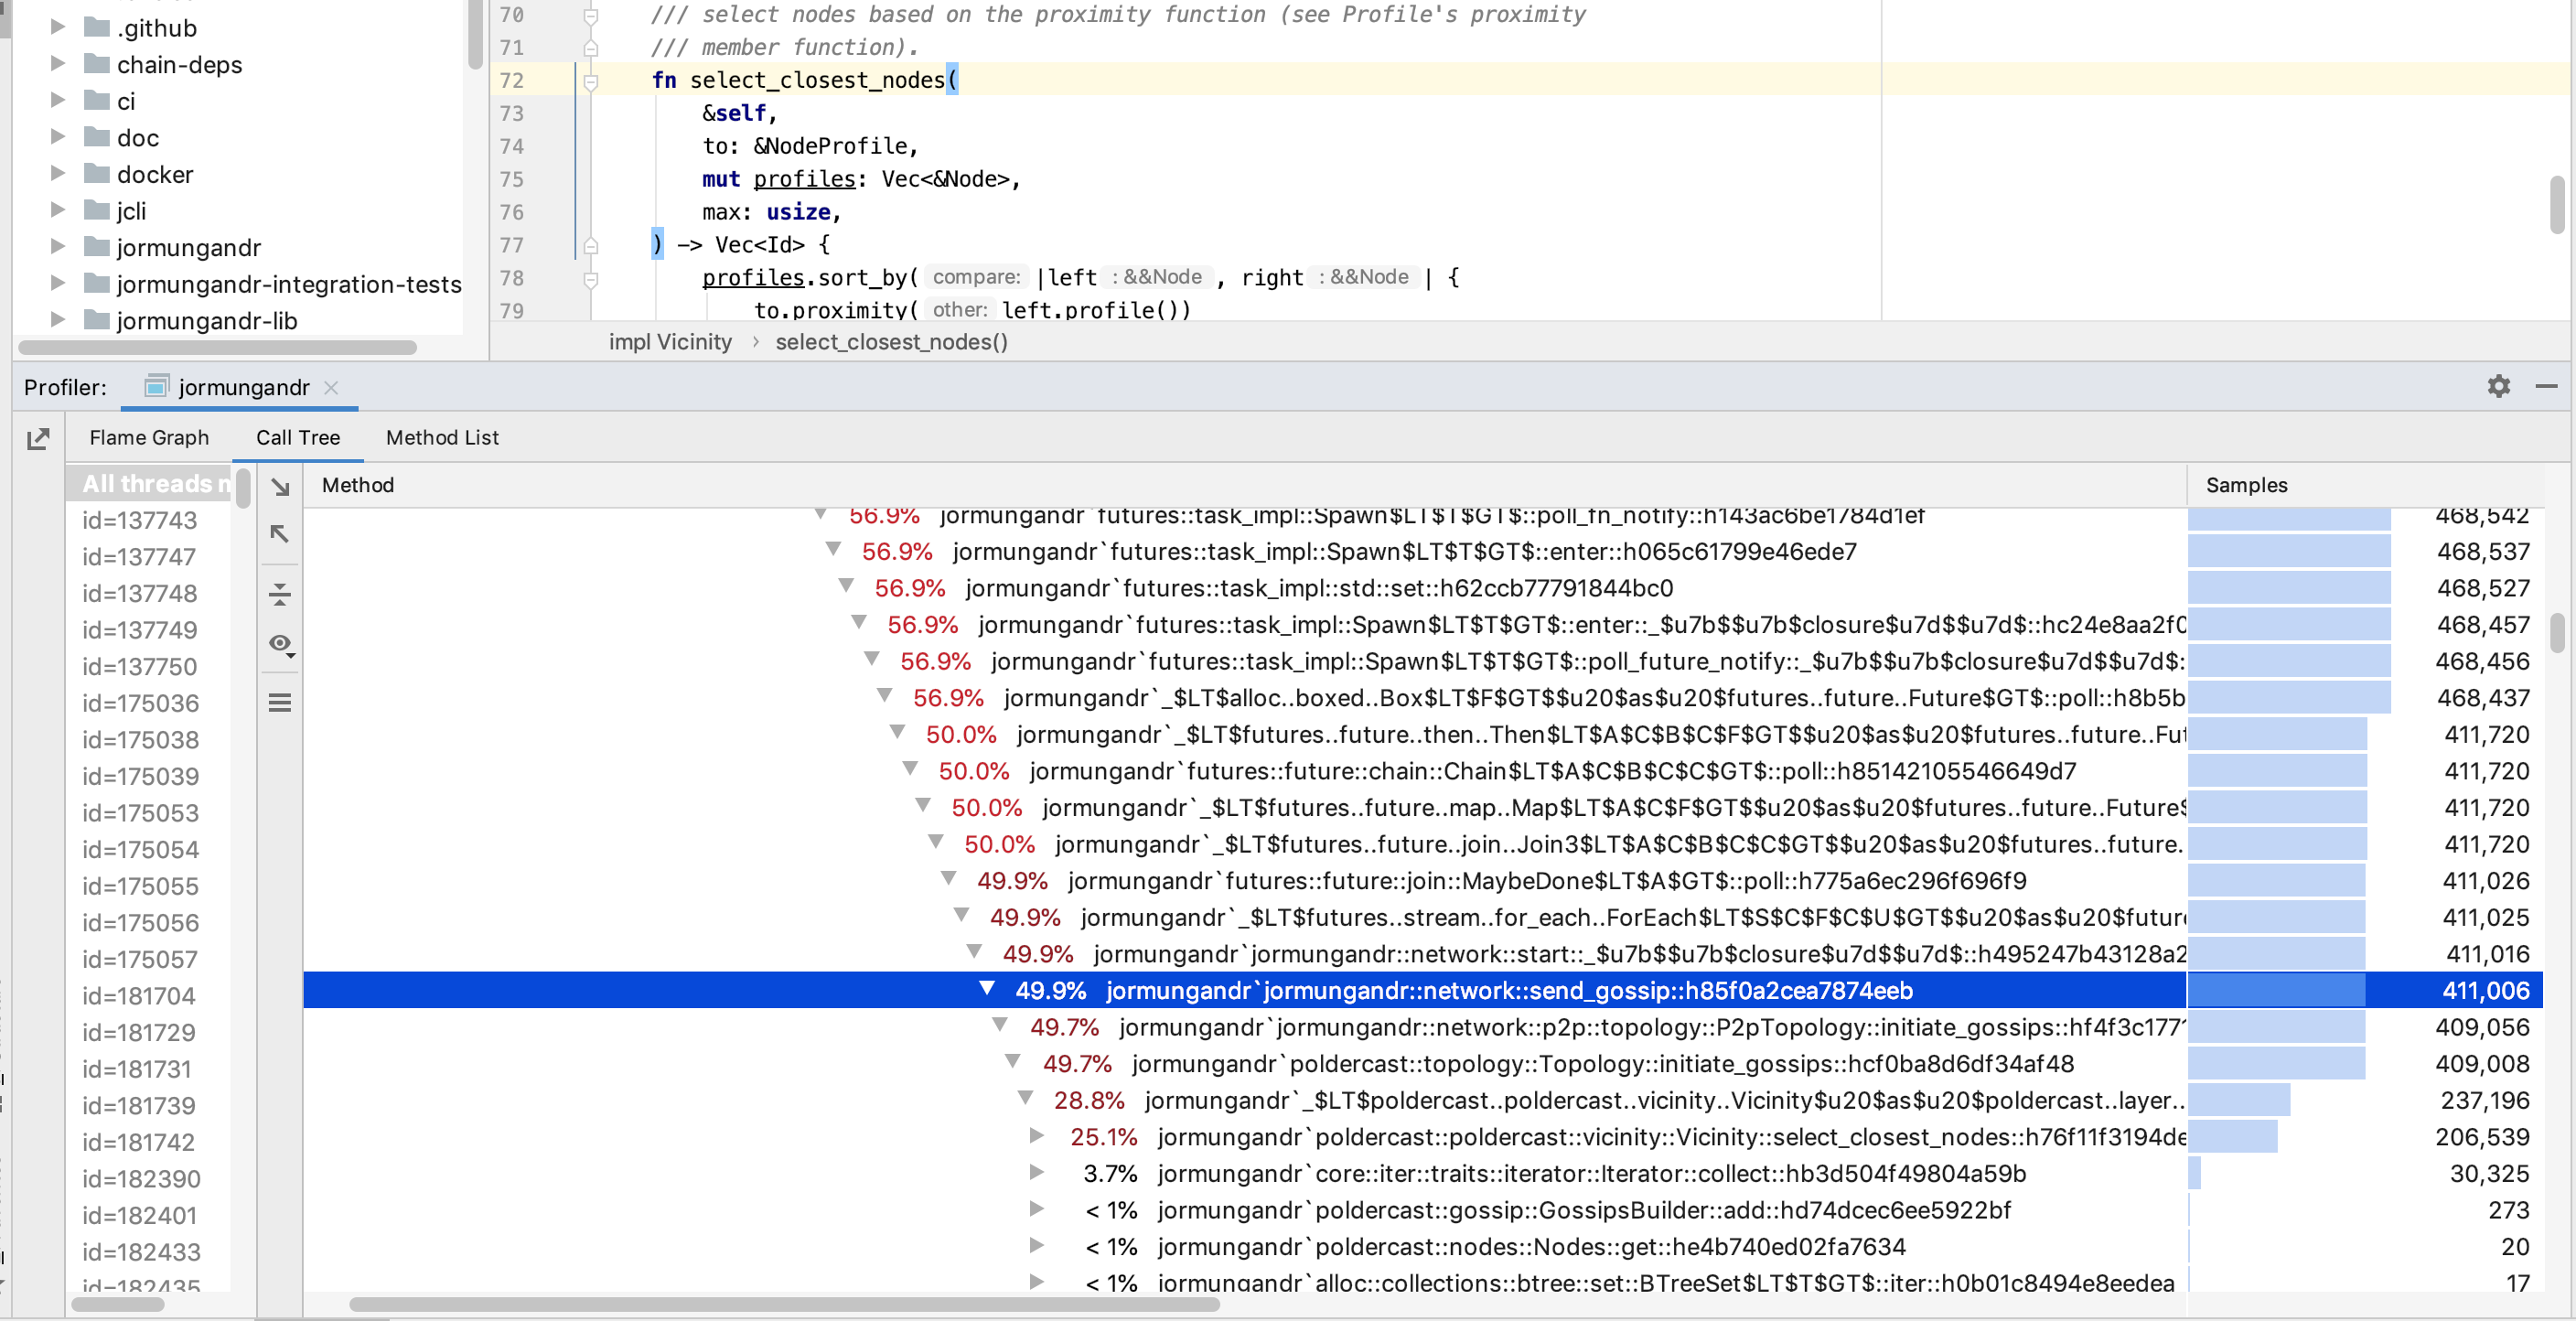
Running a 30 minute profile of Jormungandr (post bootstrap) shows that the majority of CPU usage (greater than 50%) occurs in call to jormungandr::network::send_gossip() function. Within this function, most cycles are consumed deep in the poldercast library during vicinity distance calculation (a merge sort on the total peer list is executed with each iteration).
Mandatory Information
jcli --full-versionoutput;jcli 0.8.6 (master-64780cf3, release, linux [x86_64]) - [rustc 1.39.0 (4560ea788 2019-11-04)]jormungandr --full-versionoutput:jormungandr 0.8.6 (performance-e56aada5, release, linux [x86_64]) - [rustc 1.39.0 (4560ea788 2019-11-04)]
Note: Above versions correspond to test branches that im working off, but tip of master is affected in the exact same way.
To Reproduce
Steps to reproduce the behavior:
- Start Jormungandr with public_address specified and max_connections set to 512.
- Wait a while....
Expected behavior
Jormungandr runs without failure.
Additional context
It's not clear to me if the root cause here as inefficiencies in the vicinity calculation or a build up of the peer list and subscriptions data structures that are being merge sorted often. Probably a combination of both.
Here is the specific call to sort() which within poldercast lib
One theory is that continuous restarting of nodes currently plaguing the ITN is causing the poldercast node data structures to grow more rapidly than anticipated. Perhaps a bug in the node removal policy is also a factor.
Unfortunately it is quite impossible for me to successfully bootstrap the last few epochs which has not only destroyed sandstone pools profits but also limited my ability to effectively debug this issue further!

