Ordering comp_barplot() by genus of interest #24
-
|
Hi, Is there an easy way to order samples within comp_barplot() for a specific genus of interest (i.e., if you're interested in a Prevotella, to have samples ordered in the plot by largest to smallest % Prevotella)? Is that an option within sample_order? Thanks! |
Beta Was this translation helpful? Give feedback.
Replies: 2 comments 1 reply
-
|
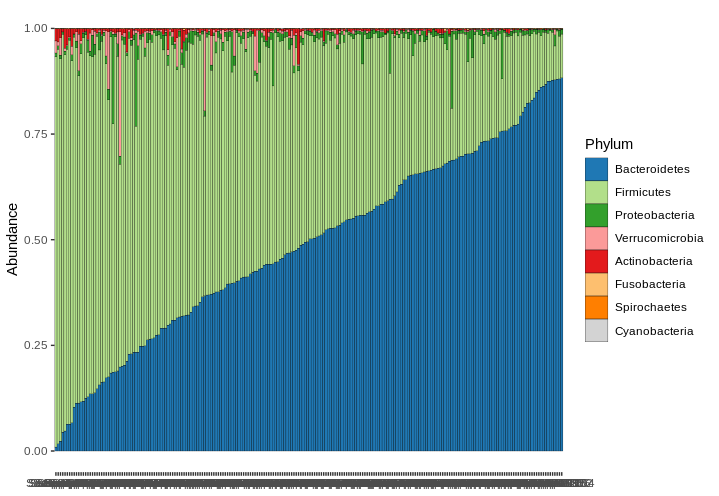
Hi @sbachas ! This is possible, by first aggregating and transforming the taxa to compositions, then arranging the samples with ps_arrange, then plotting comp_barplot with "default" sample_order, which keeps the order as already set. Here's an example, but beware that this might not look so good with a less abundant taxon. Hope this helps!
|
Beta Was this translation helpful? Give feedback.
-
|
Thank you, this is great!
One more question: when plotting the heat map using cor_heatmap(), the prevalence isn’t plotting (prev box has no data points), though abundance does plot. Do you know what could be going on?
Thanks again!
On May 6, 2021, at 2:42 PM, David Barnett ***@***.******@***.***>> wrote:
Hi @sbachas<https://github.com/sbachas> !
This is possible, by first aggregating and transforming the taxa to compositions, then arranging the samples with ps_arrange, then plotting comp_barplot with "default" sample_order, which keeps the order as already set.
Here's an example, but beware that this might not look so good with a less abundant taxon. Hope this helps!
data("dietswap", package = "microbiome")
dietswap %>%
   tax_agg("Phylum") %>%
   tax_transform("compositional") %>%
   ps_arrange(Bacteroidetes, .target = "otu_table") %>%
   comp_barplot(tax_level = "Phylum", sample_order = "default")
[11d6f3ff-1264-4c6e-948b-483f2a90431d]<https://user-images.githubusercontent.com/33695702/117368314-a5e47280-aec3-11eb-9640-9b58157e3480.png>
—
You are receiving this because you were mentioned.
Reply to this email directly, view it on GitHub<#24 (comment)>, or unsubscribe<https://github.com/notifications/unsubscribe-auth/AT7ILSAKJD3OISDZUB5WN6DTMMEMNANCNFSM44H5S77Q>.
|
Beta Was this translation helpful? Give feedback.
-
|
no problem 🙂 I'm not sure about your problem with cor_heatmap, the prevalence plot should show a barchart. |
Beta Was this translation helpful? Give feedback.
Hi @sbachas !
This is possible, by first aggregating and transforming the taxa to compositions, then arranging the samples with ps_arrange, then plotting comp_barplot with "default" sample_order, which keeps the order as already set.
Here's an example, but beware that this might not look so good with a less abundant taxon. Hope this helps!