Examples
Wiki ▸ Examples
Please, read the examples in order: their requirements are incremental.
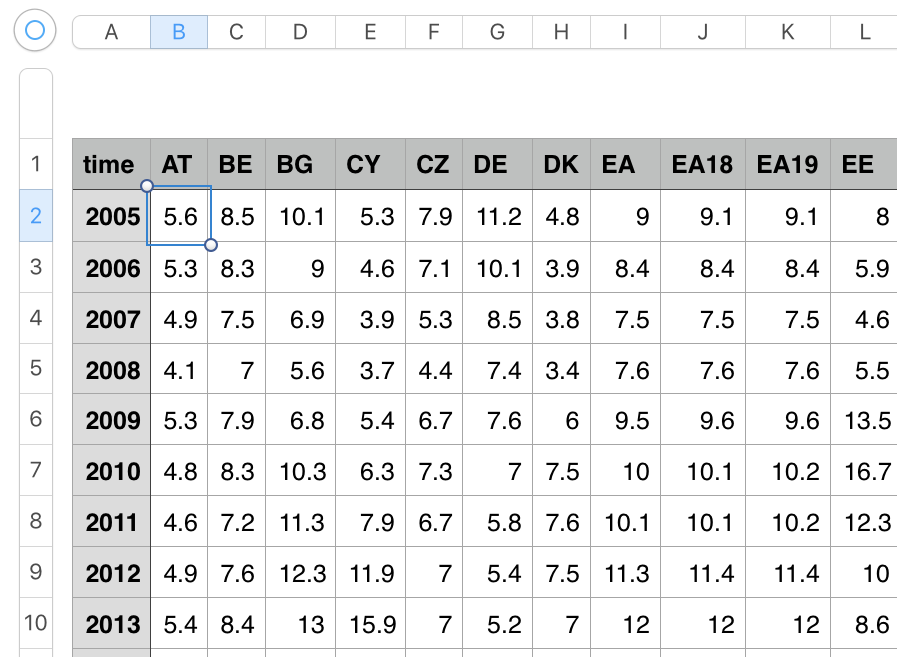
Let's assume that we must build a spreadsheet table of unemployment rate by country (columns) and year (rows).
You'll need to find the Eurostat dataset identifier. Go to
http://ec.europa.eu/eurostat/data/database
and then
Tables on EU policy
  > Employment performance monitor - indicators (tesem)
    > Unemployment rate (tesem120)
Connect to the JSON-stat Eurostat API to retrieve dataset tesem120:
http://ec.europa.eu/eurostat/wdds/rest/data/v2.1/json/en/tesem120?precision=1
You can view the contents of the dataset at
To download the dataset from the command line using Eurostat's API, run cURL:
curl http://ec.europa.eu/eurostat/wdds/rest/data/v2.1/json/en/tesem120?precision=1 -o eurostat.jsonstat
JSON-stat keeps data and metadata completely apart because it is designed to be an efficient transport format. That probably makes it human-unfriendly. Fortunately, we can use jsonstat-conv to convert JSON-stat to other formats.
If you don't have jsonstat-conv installed in your system or have a version that is lower than 0.6, please (re)install it:
npm install -g jsonstat-conv
To check your version of jsonstat-conv:
jsonstat2csv --version
jsonstat-conv includes a command to translate JSON-stat directly into CSV (jsonstat2csv). For example,
jsonstat2csv eurostat.jsonstat eurostat.csv
will produce a comma-delimited CSV using dot as the decimal mark (eurostat.csv).
If you need a semicolon-delimited CSV with comma as the decimal mark, use instead:
jsonstat2csv eurostat.jsonstat eurostat-semi.csv --column ";"
jsonstat2csv comes with several options that allow us to customize the output. For example, to include status information and rename the "Status" and "Value" columns to "symbol" and "rate":
jsonstat2csv eurostat.jsonstat eurostat-status.csv --status --vlabel rate --slabel symbol
jsonstat2csv also allows you to create a rich CSV document with extra metadata header lines (CSV-stat).
jsonstat2csv eurostat.jsonstat eurostat.jsv --rich
(CSV-stat can be converted back into JSON-stat with csv2jsonstat:
csv2jsonstat eurostat.jsv eurostat-conv.jsonstat
CSV-stat supports all JSON-stat dataset features except note, link, child, coordinates and extension. In the previous example, eurostat.jsonstat contained extension information: eurostat-conv.jsonstat is equivalent to eurostat.jsonstat, only the extension property is missing.)
jsonstat2csv, though, does not include options to change the structure of the data. These features are available only in jsonstat2arrobj which is the main way to export JSON-stat to other formats. In particular, jsonstat2arrobj converts JSON-stat into an array of objects (arrobj, from now on), which is probably the most popular structure used to exchange data in JSON. As a consequence, there are many tools to transform arrobjs into other JSON flavors or even to convert them to CSVs.
So instead of converting Eurostat's JSON-stat directly to CSV using jsonstat2csv we are going to translate it to an arrobj using jsonstat2arrobj and then convert it to CSV using open source tools.
To convert JSON-stat into an array of objects:
jsonstat2arrobj eurostat.jsonstat eurostat.json
As you probably noticed, the eurostat.json does not have the structure we need in our spreadsheet (country in columns and year in rows). By default, jsonstat2arrobj stores the value for each combination of categories in a property called value:
[
  {
    "unit": "Percentage of active population",
    "sex": "Total",
    "age": "Total",
    "time": "2005",
    "geo": "Austria",
    "value": 5.6
  },
  ...
]
Instead, we need to have a property for each category of the geo dimension (where the country information is) to store their values for each combination of the categories of the rest of the dimensions:
[
  {
    "unit": "Percentage of active population",
    "sex": "Total",
    "age": "Total",
    "time": "2005",
    "AT": 5.6,
    "BE": 8.5,
    "BG": 10.1,
    "CY": 5.3,
    ...
  },
  ...
]
That is, we need to transpose the values by geo:
jsonstat2arrobj eurostat.jsonstat eurostat-transp.json --by geo
Dataset tesem120 contains several single-category dimensions: sex and age are always "Total" and unit is always "Percentage of active population". Correction: That was true in the past, but at some point tesem120 began including data by sex. This could also happen in the future with age or even unit. Because we are only interested in unemployment as a percentage of active population (PC_ACT) and we don't care about sex or age, we need to create a subset of eurostat.jsonstat:
jsonstatslice eurostat.jsonstat eurostat-subset.jsonstat --filter sex=T,age=TOTAL,unit=PC_ACT
Now that we are sure that sex, age and unit are single-category dimensions, we can remove them from the transposed JSON:
jsonstat2arrobj eurostat-subset.jsonstat eurostat-drop.json --by geo --drop sex,age,unit
For this task, there are many tools out there. We will be using d3-dsv, which includes a json2csv command.
npm install -g d3-dsv
To convert our last JSON to CSV:
json2csv < eurostat-drop.json > eurostat.csv
The resulting CSV has comma as the column delimiter and dot as the decimal mark. If what you need is a CSV with comma as the decimal mark, first you must use the jsonstat2arrobj --comma (decimal mark) option:
jsonstat2arrobj eurostat-subset.jsonstat eurostat-comma.json --by geo --drop sex,age,unit --comma
And then specify in json2csv a different column delimiter (for example, a semicolon):
json2csv < eurostat-comma.json > eurostat-semi.csv -w ";"
All the process has required three lines and three files (eurostat.jsonstat, eurostat-drop.json, eurostat.csv):
curl http://ec.europa.eu/eurostat/wdds/rest/data/v2.1/json/en/tesem120?precision=1 -o eurostat.jsonstat

jsonstatslice eurostat.jsonstat eurostat-subset.jsonstat --filter sex=T,age=TOTAL,unit=PC_ACT

jsonstat2arrobj eurostat-subset.jsonstat eurostat-drop.json --by geo --drop sex,age,unit

json2csv < eurostat-drop.json > eurostat.csv
This is not necessary, though: all the process can be done in a single line, piping the output of a program to another program. For that, we need to enable jsonstat2arrobj stream interface (--stream) which will allow us to use pipes (|) and redirects (<, >).
In the stream interface, this command
jsonstat2arrobj eurostat.jsonstat eurostat.json
must be rewritten as
jsonstat2arrobj < eurostat.jsonstat > eurostat.json --stream
So to get a comma-delimited CSV with dot as the decimal mark in a single line:
curl http://ec.europa.eu/eurostat/wdds/rest/data/v2.1/json/en/tesem120?precision=1 | jsonstatslice --filter sex=T,age=TOTAL,unit=PC_ACT --stream | jsonstat2arrobj --by geo --drop sex,age,unit --stream | json2csv > eurostat.csv
Or a little shorter:
curl http://ec.europa.eu/eurostat/wdds/rest/data/v2.1/json/en/tesem120?precision=1 | jsonstatslice -f sex=T,age=TOTAL,unit=PC_ACT -t | jsonstat2arrobj -b geo -d sex,age,unit -t | json2csv > eurostat.csv
And to get a semicolon-delimited CSV with comma as the decimal mark:
curl http://ec.europa.eu/eurostat/wdds/rest/data/v2.1/json/en/tesem120?precision=1 | jsonstatslice -f sex=T,age=TOTAL,unit=PC_ACT -t | jsonstat2arrobj -b geo -d sex,age,unit -k -t | json2csv > eurostat-semi.csv -w ";"
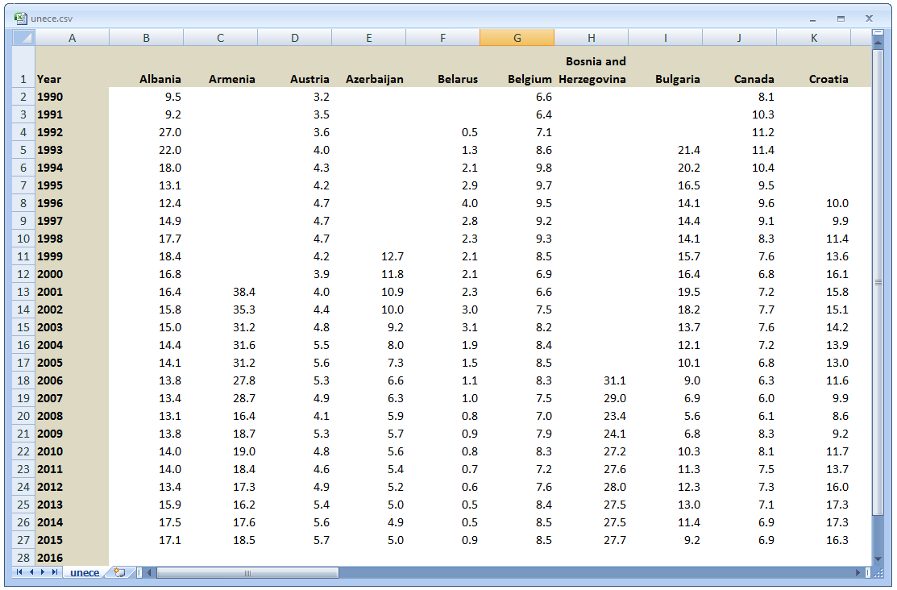
Let's assume that we must build a spreadsheet table of unemployment rate by country (columns) and year (rows), but this time based on UNECE's data.
The requirements are the same as in Eurostat's example, so please read it first if you haven't.
First, we need to find the UNECE table with such information. Visit the UNECE Statistical Database
http://w3.unece.org/PXWeb2015/pxweb/en/STAT/
and then
UNECE Statistical Database
  > Country Overviews
    > UNECE Member Countries in Figures
      > Country Overview by Country and Time
On table Country Overview by Country and Time select Unemployment rate as Indicator, all countries for the Country dimension and all years for the Year dimension. Then build the table (Table - Layout 1) and select the About table tab.
At the bottom of the page, click on Make this table available in your application to get the URL and the JSON query needed to connect to UNECE's API and retrieve the unemployment rate for all countries and all years.
URL
http://w3.unece.org/PXWeb2015/api/v1/en/STAT/10-CountryOverviews/01-Figures/ZZZ_en_CoSummary_r.px
JSON query
{
  "query": [
    {
      "code": "Indicator",
      "selection": {
        "filter": "item",
        "values": [ "c0000233" ]
      }
    },
    {
      "code": "Country",
      "selection": {
        "filter": "item",
        "values": [ "008", "051", "040", "031", "112", "056", "070", "100", "124", "191", "196", "203", "208", "233", "246", "250", "268", "276", "300", "348", "352", "372", "376", "380", "398", "417", "428", "440", "442", "470", "498", "499", "528", "578", "616", "620", "642", "643", "688", "703", "705", "724", "752", "756", "762", "807", "792", "795", "804", "826", "840", "860" ]
      }
    }
  ],
  "response": {
    "format": "px"
  }
}
The URL determines the table we are retrieving the information from. The JSON query specifies what data should be retrieved and how it should be formatted. In the example above, we are selecting Indicator c0000233 (unemployment rate) and all the available countries (008, 051, 040, 031, ...). There is no time filter, meaning all available years will be included in the response. Finally the response format by default is px. We need to change it to json-stat:
JSON query (long version)
{
  "query": [
    {
      "code": "Indicator",
      "selection": {
        "filter": "item",
        "values": [ "c0000233" ]
      }
    },
    {
      "code": "Country",
      "selection": {
        "filter": "item",
        "values": [ "008", "051", "040", "031", "112", "056", "070", "100", "124", "191", "196", "203", "208", "233", "246", "250", "268", "276", "300", "348", "352", "372", "376", "380", "398", "417", "428", "440", "442", "470", "498", "499", "528", "578", "616", "620", "642", "643", "688", "703", "705", "724", "752", "756", "762", "807", "792", "795", "804", "826", "840", "860" ]
      }
    }
  ],
  "response": {
    "format": "json-stat"
  }
}
This query can be simplified a little. The UNECE Statistical Database uses the PC-Axis API. In the example, countries are selected one by one using UNECE's country code (008, 051, 040, 031, ...), but the API supports a general syntax to select all the categories of a dimension ("filter": "all", "values": ["*"]):
JSON query (shorter version)
{
  "query": [
    {
      "code": "Indicator",
      "selection": {
        "filter": "item",
        "values": [
          "c0000233"
        ]
      }
    },
    {
      "code": "Country",
      "selection": {
        "filter": "all",
        "values": ["*"]
     }
    }
  ],
  "response": {
    "format": "json-stat"
  }
}
To download the dataset from the command line using the long version, let's run cURL:
curl -X POST -d '{ "query": [ { "code": "Indicator", "selection": { "filter": "item", "values": [ "c0000233" ] } }, { "code": "Country", "selection": { "filter": "item", "values": [ "008", "051", "040", "031", "112", "056", "070", "100", "124", "191", "196", "203", "208", "233", "246", "250", "268", "276", "300", "348", "352", "372", "376", "380", "398", "417", "428", "440", "442", "470", "498", "499", "528", "578", "616", "620", "642", "643", "688", "703", "705", "724", "752", "756", "762", "807", "792", "795", "804", "826", "840", "860" ] } } ], "response": { "format": "json-stat" } }' http://w3.unece.org/PXWeb2015/api/v1/en/STAT/10-CountryOverviews/01-Figures/ZZZ_en_CoSummary_r.px -o unece.jsonstat
Or using the shorter version of the JSON query:
curl -X POST -d '{ "query": [ { "code": "Indicator", "selection": { "filter": "item", "values": [ "c0000233" ] } }, { "code": "Country", "selection": { "filter": "all", "values": [ "*" ] } } ], "response": { "format": "json-stat" } }' http://w3.unece.org/PXWeb2015/api/v1/en/STAT/10-CountryOverviews/01-Figures/ZZZ_en_CoSummary_r.px -o unece.jsonstat
On Windows, quotes are treated differently: we'll need to rewrite the previous two lines as:
curl -X POST -d "{ \"query\": [ { \"code\": \"Indicator\", \"selection\": { \"filter\": \"item\", \"values\": [ \"c0000233\" ] } }, { \"code\": \"Country\", \"selection\": { \"filter\": \"item\", \"values\": [ \"008\", \"051\", \"040\", \"031\", \"112\", \"056\", \"070\", \"100\", \"124\", \"191\", \"196\", \"203\", \"208\", \"233\", \"246\", \"250\", \"268\", \"276\", \"300\", \"348\", \"352\", \"372\", \"376\", \"380\", \"398\", \"417\", \"428\", \"440\", \"442\", \"470\", \"498\", \"499\", \"528\", \"578\", \"616\", \"620\", \"642\", \"643\", \"688\", \"703\", \"705\", \"724\", \"752\", \"756\", \"762\", \"807\", \"792\", \"795\", \"804\", \"826\", \"840\", \"860\" ] } } ], \"response\": { \"format\": \"json-stat\" } }" http://w3.unece.org/PXWeb2015/api/v1/en/STAT/10-CountryOverviews/01-Figures/ZZZ_en_CoSummary_r.px -o unece.jsonstat
curl -X POST -d "{ \"query\": [ { \"code\": \"Indicator\", \"selection\": { \"filter\": \"item\", \"values\": [ \"c0000233\" ] } }, { \"code\": \"Country\", \"selection\": { \"filter\": \"all\", \"values\": [ \"*\"] } } ], \"response\": { \"format\": \"json-stat\" } }" http://w3.unece.org/PXWeb2015/api/v1/en/STAT/10-CountryOverviews/01-Figures/ZZZ_en_CoSummary_r.px -o unece.jsonstat
This part is similar to the Eurostat one: we need to transpose by Country and drop Indicator (it's always Unemployment rate because that's the only category we selected in the JSON query):
jsonstat2arrobj unece.jsonstat unece-transp.json --by Country --drop Indicator
Unfortunately, UNECE does not use 2-letter country codes. What country is 008? The result is not as user-friendly as Eurostat's.
Fortunately, we can use the label instead of the identifier as the name of each category of the transposed dimension with the --bylabel (-l) option:
jsonstat2arrobj unece.jsonstat unece.json --by Country --bylabel --drop Indicator
If we need to use comma as the decimal mark:
jsonstat2arrobj unece.jsonstat unece-comma.json --by Country --bylabel --drop Indicator --comma
Nothing new here: read Eurostat's example if you haven't.
json2csv < unece.json > unece.csv
If we want to use semicolon as the column delimiter:
json2csv < unece-comma.json > unece-semi.csv -w ";"
Comma-delimited CSV with dot as the decimal mark:
curl -X POST -d '{ "query": [ { "code": "Indicator", "selection": { "filter": "item", "values": [ "c0000233" ] } }, { "code": "Country", "selection": { "filter": "all", "values": [ "*" ] } } ], "response": { "format": "json-stat" } }' http://w3.unece.org/PXWeb2015/api/v1/en/STAT/10-CountryOverviews/01-Figures/ZZZ_en_CoSummary_r.px | jsonstat2arrobj -b Country -d Indicator -l -t | json2csv > unece.csv
On Windows:
curl -X POST -d "{ \"query\": [ { \"code\": \"Indicator\", \"selection\": { \"filter\": \"item\", \"values\": [ \"c0000233\" ] } }, { \"code\": \"Country\", \"selection\": { \"filter\": \"all\", \"values\": [ \"*\"] } } ], \"response\": { \"format\": \"json-stat\" } }" http://w3.unece.org/PXWeb2015/api/v1/en/STAT/10-CountryOverviews/01-Figures/ZZZ_en_CoSummary_r.px | jsonstat2arrobj -b Country -d Indicator -l -t | json2csv > unece.csv
Semicolon-delimited CSV with comma as the decimal mark:
curl -X POST -d '{ "query": [ { "code": "Indicator", "selection": { "filter": "item", "values": [ "c0000233" ] } }, { "code": "Country", "selection": { "filter": "all", "values": [ "*" ] } } ], "response": { "format": "json-stat" } }' http://w3.unece.org/PXWeb2015/api/v1/en/STAT/10-CountryOverviews/01-Figures/ZZZ_en_CoSummary_r.px | jsonstat2arrobj -b Country -d Indicator -l -k -t | json2csv > unece-semi.csv -w ";"
On Windows:
curl -X POST -d "{ \"query\": [ { \"code\": \"Indicator\", \"selection\": { \"filter\": \"item\", \"values\": [ \"c0000233\" ] } }, { \"code\": \"Country\", \"selection\": { \"filter\": \"all\", \"values\": [ \"*\"] } } ], \"response\": { \"format\": \"json-stat\" } }" http://w3.unece.org/PXWeb2015/api/v1/en/STAT/10-CountryOverviews/01-Figures/ZZZ_en_CoSummary_r.px | jsonstat2arrobj -b Country -d Indicator -l -k -t | json2csv > unece-semi.csv -w ";"
Like UNECE's, Statistics Norway's API is rich and powerful and allows a high degree of dataset customization. Flexibility comes, of course, at a price: (JSON query's) complexity. Statistics Norway also offers ready-made datasets. Statistics Norway has predefined a collection of datasets, based on its most popular tables. The trade-off: these datasets cannot be customized.
Take, for example, dataset 1082: it contains the population, by sex and one-year age groups and is perfect to build a population pyramid. But, what if instead we are interested in the total population by age group? Dataset 1082 does contain the male and female population but not the total population. Could we compute it on the fly from the terminal? In a single line? Yes, we can.
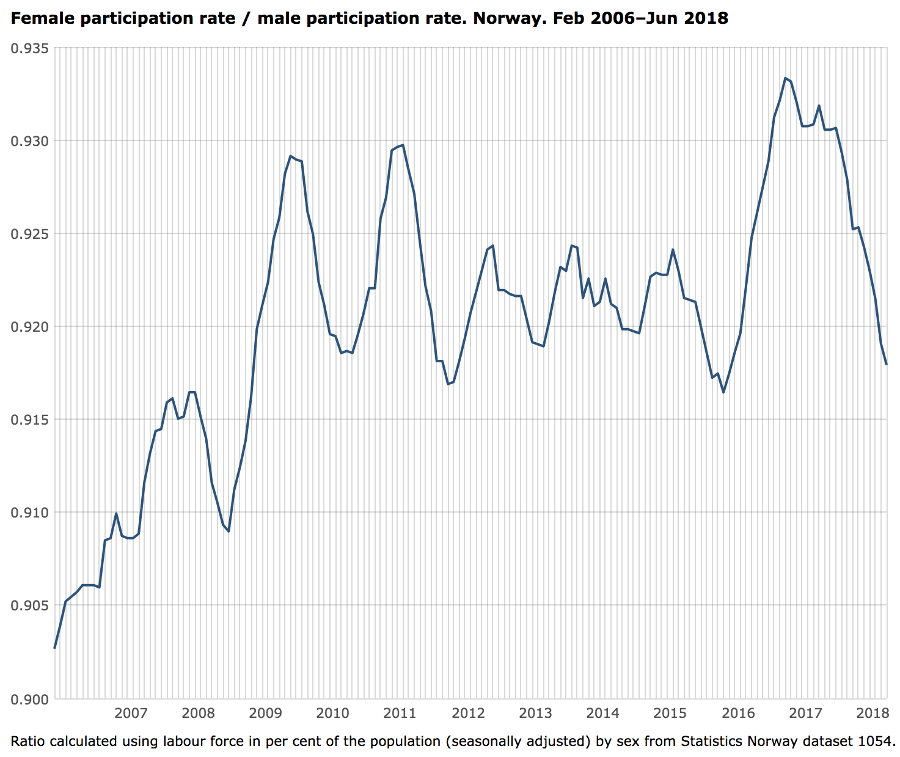
Let's assume that we must analyze the differences in the participation rate between men and women in the Norwegian labor market. We want to use as indicator the female participation rate divided by the male participation rate.
Dataset 1052 from Statistics Norway provides a monthly time series of the main labor market concepts by sex and age (more than 18,000 values). Dataset 1082 in the JSON-stat format is available at:
http://data.ssb.no/api/v0/dataset/1054.json?lang=en
You can view the contents of the dataset at
To download the dataset from the command line, run cURL:
curl http://data.ssb.no/api/v0/dataset/1054.json?lang=en -o no.jsonstat
The dataset is big because it contains many indicators available by sex and age (besides time). Because we are going to calculate our ratio using the "Labour force in per cent of the population (seasonally adjusted)" (ArbstyrkP1), we don't really need any other categories of the ContentsCode dimension. And because we are not going to compute results by age (Alder), we just need to keep the 15-74 category. Creating a JSON-stat subset is easy with jsonstatslice.
jsonstatslice no.jsonstat no-subset.jsonstat --filter ContentsCode=ArbstyrkP1,Alder=15-74
Like in previous examples, we will use jsonstat2arrobj to convert JSON-stat to an array of objects. We will need to transpose by sex (Kjonn) to be able to compute the ratio.
jsonstat2arrobj no-subset.jsonstat no.json --by Kjonn
In the output, dimensions are named according to their identifier (age is Alder, concept is ContentsCode, time is Tid). And by default, categories of transposed dimensions are also named according to their identifier (males, females and both sexes are "1", "2" and "0").
[
  {
    "0": 71.4,
    "1": 75,
    "2": 67.7,
    "Alder": "15-74 years",
    "ContentsCode": "Labour force in per cent of the population, seasonally adjusted",
    "Tid": "2006M02"
  },
  ...
]
But by default categories are named according to their label. The --cid option allows us to change the default behavior.
jsonstat2arrobj no-subset.jsonstat no-id.json --by Kjonn --cid
[
  {
   "0": 71.4,
   "1": 75,
   "2": 67.7,
   "Alder": "15-74",
   "ContentsCode": "ArbstyrkP1",
   "Tid": "2006M02"
  },
  ...
]
The output is shorter and the rules that must be applied later will be simpler.
To filter missing values we need to be able to process the JSON output, element by element in the array. One way to achieve this is translating JSON into Newline Delimited JSON (NDJSON). For this task we will be using ndjson-cli.
npm install -g ndjson-cli
To convert JSON to NDJSON:
ndjson-split < no-id.json > no.ndjson
Now, instead of a single line with an array of objects, we have as many lines as objects.
{"0":71.4,"1":75,"2":67.7,"Alder":"15-74","ContentsCode":"ArbstyrkP1","Tid":"2006M02"}
{"0":71.4,"1":74.9,"2":67.7,"Alder":"15-74","ContentsCode":"ArbstyrkP1","Tid":"2006M03"}
{"0":71.4,"1":74.9,"2":67.8,"Alder":"15-74","ContentsCode":"ArbstyrkP1","Tid":"2006M04"}
...
ndjson-cli provides a command to filter lines: ndjson-filter. We only need to provide the JavaScript filter condition that must be applied to each line. In our example, each line is an object that can be accessed in ndjson-filter as d.
Because we don't want to keep lines that have missing values for ArbstyrkP1, we will filter:
d['0']!==null(The 0 property has the value for both sexes.)
ndjson-filter "d['0']!==null" < no.ndjson > no-filtered.ndjson
Now we need to compute the female (d['2']) / male (d['1']) ratio. We want to transform each line into a JSON that looks like this:
{
  "time": "2006M02",
  "ratio": 0.8996036988110964
}
ndjson-map is the command for the job:
ndjson-map "{time: d.Tid, ratio: d['2']/d['1']}" < no-filtered.ndjson > no-ratio.ndjson
But this is still NDJSON: to go back to JSON (an array of objects), use ndjson-reduce:
ndjson-reduce < no-ratio.ndjson > no-ratio.json
(In the Irish Example, we will see that ndjson-reduce is not actually required.)
Like in the previous examples, for this task we will use d3-dsv, which includes a json2csv command:
json2csv < no-ratio.json > no.csv
time,ratio
2006M02,0.9026666666666667
2006M03,0.9038718291054739
2006M04,0.90520694259012
2006M05,0.9054593874833556
2006M06,0.905710491367862
2006M07,0.9060846560846562
...
In a single line:
curl http://data.ssb.no/api/v0/dataset/1054.json?lang=en | jsonstatslice -f ContentsCode=ArbstyrkP1,Alder=15-74 -t | jsonstat2arrobj -b Kjonn -c -t | ndjson-split | ndjson-filter "d['0']!==null" | ndjson-map "{time: d.Tid, ratio: d['2']/d['1']}" | ndjson-reduce | json2csv > no.csv
What if we wanted to build a line chart like this one
https://idescat.github.io/visual/g/?id=783e8ac99d7f0a67c5a9e0c7ee0782d9
?
This was built using the Visual Maker, a tool based on Visual.
To draw a time series in a line chart, Visual expects that we provide two separate arrays: a data array
[
  0.9026666666666667,
  0.9038718291054739,
  0.90520694259012,
  ...
]
and a time array
[
  "200602",
  "200603",
  "200604",
  ...
]
(Notice that the time format is not the same we have.)
Producing these two arrays from previous no-ratio.ndjson is very simple:
ndjson-map "d.time.slice(0,4)+d.time.slice(5,7)" < no-ratio.ndjson | ndjson-reduce > time.json
ndjson-map "d.ratio" < no-ratio.ndjson | ndjson-reduce > data.json
(You can see the actual code of the visualization in this gist: see property files.source.json.content.)
Of course, this example was designed for demo purposes: do not retrieve a ready-made dataset with more than 18,000 values when you only care about less than 300! There is a better way! At least, in Norway: build your own customized dataset from table 08931 selecting ArbstyrkP1 as the only concept (male, female, no age groups).
Like this:
curl -X POST -d '{ "query": [ { "code": "Kjonn", "selection": { "filter": "item", "values": [ "1", "2" ] } }, { "code": "ContentsCode", "selection": { "filter": "item", "values": [ "ArbstyrkP1" ] } } ], "response": { "format": "json-stat" } }' http://data.ssb.no/api/v0/en/table/08931 | jsonstat2arrobj -b Kjonn -c -t | ndjson-split | ndjson-filter "d['1']!==null" | ndjson-map "{time: d.Tid, ratio: d['2']/d['1']}" | ndjson-reduce | json2csv > no.csv
On Windows use this version instead:
curl -X POST -d "{ \"query\": [ { \"code\": \"Kjonn\", \"selection\": { \"filter\": \"item\", \"values\": [ \"1\", \"2\" ] } }, { \"code\": \"ContentsCode\", \"selection\": { \"filter\": \"item\", \"values\": [ \"ArbstyrkP1\" ] } } ], \"response\": { \"format\": \"json-stat\" } }" http://data.ssb.no/api/v0/en/table/08931 | jsonstat2arrobj -b Kjonn -c -t | ndjson-split | ndjson-filter "d['1']!==null" | ndjson-map "{time: d.Tid, ratio: d['2']/d['1']}" | ndjson-reduce | json2csv > no.csv
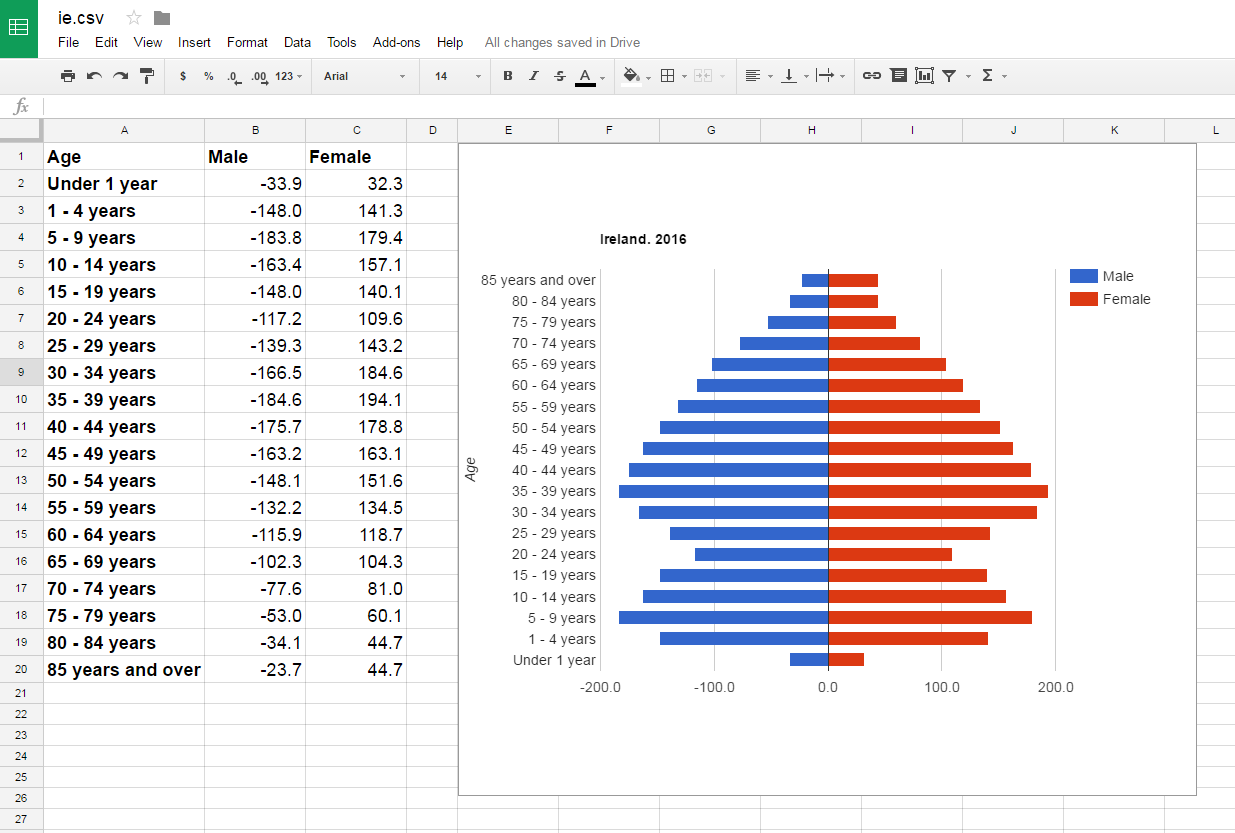
Let's assume that we must build the population pyramid of Ireland.
You'll need to find the JSON-stat dataset URL on CSO's Statbank API. Go to
http://www.cso.ie/webserviceclient/DatasetListing.aspx
and then
People and Society
  > Annual Population Estimates
    > Population Estimates (Persons in April) by Age Group, Sex and Year
Dataset PEA01 from CSO provides a yearly time series of population by sex. It is available in the JSON-stat format at:
http://www.cso.ie/StatbankServices/StatbankServices.svc/jsonservice/responseinstance/PEA01
You can view the contents of the dataset at
To download the dataset from the command line, run cURL:
curl http://www.cso.ie/StatbankServices/StatbankServices.svc/jsonservice/responseinstance/PEA01 -o ie.jsonstat
In this step, we will convert the JSON-stat file into an array of objects transposing dimension Sex. The dataset contains a dimension (Statistic) with a single category (Population Estimates (Persons in April) (Thousand)): we won't need it. Using jsonstat2arrobj like in previous examples:
jsonstat2arrobj ie.jsonstat ie.json --drop Statistic --by Sex --bylabel
Or using the stream interface:
jsonstat2arrobj < ie.jsonstat > ie.json --drop Statistic --by Sex --bylabel --stream
The only difference between the previous two lines is that in the stream interface ie.json will be written even though it already existed while in the non-stream interface a new filename is used to avoid losing the content of an existing file.
To filter data we need to be able to process the JSON output, element by element in the array. As in the Norwegian example, we will be using ndjson-cli for this.
First we need to convert JSON to NDJSON:
ndjson-split < ie.json > ie.ndjson
Because we are only interested in data for the latest year (2016 at the time of writing), we need to apply this filtering condition:
d.Year==='2016'We also want to remove the age total (All ages) and all the subtotals included in the dataset:
- 15 years and over
- 65 years and over
- 0 - 4 years
- 0 - 14 years
- 15 - 24 years
- 25 - 44 years
- 45 - 64 years
They are not needed to build a population pyramid. One way to achieve this in JavaScript is:
[
  'All ages',
  '15 years and over',
  '65 years and over',
  '0 - 4 years',
  '0 - 14 years',
  '15 - 24 years',
  '25 - 44 years',
  '45 - 64 years'
].indexOf( d['Age Group'] ) < 0
The resulting filtering command is then:
ndjson-filter "d.Year==='2016' && ['All ages', '15 years and over', '65 years and over', '0 - 4 years', '0 - 14 years', '15 - 24 years', '25 - 44 years', '45 - 64 years'].indexOf(d['Age Group'])<0" < ie.ndjson > ie-filtered.ndjson
Many visualization tools do not have pyramids as a type of chart, because they are actually just a special case of a bar chart where the male values have negative values. This is the case of Google Sheets, the tool we are going to use. So the next step is to keep only the information we want and multiply male values by -1.
ndjson-map "{ Age: d['Age Group'], Sex: d.Sex, Male: -1*d.Male, Female: d.Female }" < ie-filtered.ndjson > ie-pyram.ndjson
In the Norwegian example, we used ndjson-reduce to go back from NDJSON to JSON.
ndjson-reduce < ie-pyram.ndjson > ie-pyram.json
But this is not strictly necessary.
It is not strictly necessary because json2csv supports NDJSON as input (-n option):
json2csv -n < ie-pyram.ndjson > ie.csv
leads to the same result as:
json2csv < ie-pyram.json > ie.csv
We've ended up with a CSV that looks like this:
Age,Male,Female
Under 1 year,-33.9,32.3
1 - 4 years,-148,141.3
5 - 9 years,-183.8,179.4
10 - 14 years,-163.4,157.1
15 - 19 years,-148,140.1
...
In a single line:
curl http://www.cso.ie/StatbankServices/StatbankServices.svc/jsonservice/responseinstance/PEA01 | jsonstat2arrobj -d Statistic -b Sex -l -t | ndjson-split | ndjson-filter "d.Year==='2016' && ['All ages', '15 years and over', '65 years and over', '0 - 4 years', '0 - 14 years', '15 - 24 years', '25 - 44 years', '45 - 64 years'].indexOf(d['Age Group'])<0" | ndjson-map "{Age: d['Age Group'], Sex: d.Sex, Male: -1*d.Male, Female: d.Female}" | json2csv -n > ie.csv
Finally, we import our CSV into Google Sheets. There, we must highlight all the data (including labels), click on the Insert chart icon, select the horizontal bar chart in the Recommendations tab and, in the Customization tab, check the Stack and Reverse boxes.
And that's all!
According to the World Happiness Report 2016 Update, people who live in Denmark are the happiest in the world. Let's try to build a simple summary report on Danish quality of life key figures like this one:
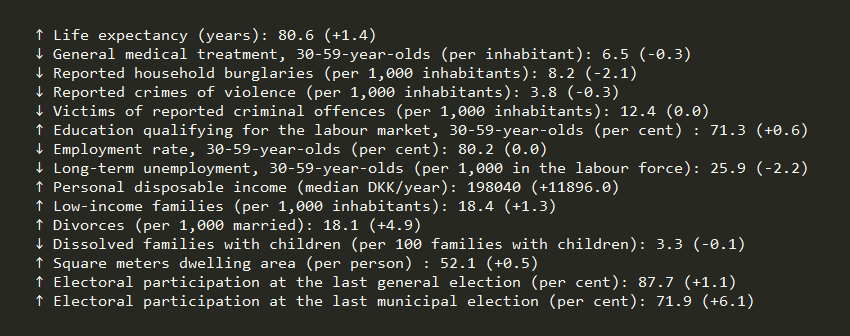
In this example we will use the tools also shown in the previous ones (jsonstat-conv, ndjson-cli) but we will add a new one to the formula: ndjson-format, a module that allows you to format NDJSON using a ES2015 template literals.
npm install -g jsonstat-format
Dataset LIVO1 available in the Statistics Denmark API has exactly the information we need. At the time of writing, this dataset contained a time series from 2008 to 2015. To simplify the analysis we will compare 2014 with 2010 (the latest year available has missing values and so do the first years). The customized JSON-stat dataset we will use is:
http://api.statbank.dk/v1/data/LIVO1/JSONSTAT?lang=en&Tid=2010%2C2014&AKTP=*
You can view the contents of the dataset at
To download the dataset from the command line, run cURL:
curl "http://api.statbank.dk/v1/data/LIVO1/JSONSTAT?lang=en&Tid=2010%2C2014&AKTP=*" -o dk.jsonstat
Because we want to compute the 2014-2010 change in the different key figures, we will transpose the data by time (Tid) and drop the constant dimensions (ContentsCode):
jsonstat2arrobj < dk.jsonstat > dk.json --by Tid --label --drop ContentsCode --stream
Nothing new under the sun so far.
This is the kind of output we are looking for:
↑ Life expectancy (years): 80.6 (+1.4)
↓ General medical treatment, 30-59-year-olds (per inhabitant): 6.5 (-0.3)
...
The first thing we need is a symbol indicating if the key figure increased (↑) or decreased (↓) between 2010 and 2014. Using ES2015 template literals, if this represents an element in the array:
`${this["2014"] > this["2010"] ? "\u2191" : "\u2193"}`Then we need to retrieve the key figure name (AKTP) and its value in 2014:
`${this["AKTP"]}: ${this["2014"]}`Finally we want to include, in brackets, the change between the two years rounded off to one decimal place, adding a + if the difference is positive:
`(${this["2014"] > this["2010"] ? "+" : ""}${(this["2014"]-this["2010"]).toFixed(1)})`The full template literal is:
`${this["2014"] > this["2010"] ? "\u2191" : "\u2193"} ${this["AKTP"]}: ${this["2014"]} (${this["2014"] > this["2010"] ? "+" : ""}${(this["2014"]-this["2010"]).toFixed(1)})`ndjson-format allows us to transform NDJSON using template literals. To be able to use ndjson-format first we need to convert dk.json into NDJSON with ndjson-split (included in ndjson-cli):
ndjson-split < dk.json | ndjson-format > dk.txt '${this["2014"]>this["2010"] ? "\u2191" : "\u2193"} ${this["AKTP"]}: ${this["2014"]} (${this["2014"]>this["2010"] ? "+" : ""}${(this["2014"]-this["2010"]).toFixed(1)})'
On Windows, quotes are treated differently: the previous line must be rewritten as:
ndjson-split < dk.json | ndjson-format > dk.txt "${this['2014']>this['2010'] ? '\u2191' : '\u2193'} ${this['AKTP']}: ${this['2014']} (${this['2014']>this['2010'] ? '+' : ''}${(this['2014']-this['2010']).toFixed(1)})"
All the process in a single line:
curl "http://api.statbank.dk/v1/data/LIVO1/JSONSTAT?lang=en&Tid=2010%2C2014&AKTP=*" | jsonstat2arrobj -b Tid -l -d ContentsCode -t | ndjson-split | ndjson-format > dk.txt '${this["2014"]>this["2010"] ? "\u2191" : "\u2193"} ${this["AKTP"]}: ${this["2014"]} (${this["2014"]>this["2010"] ? "+" : ""}${(this["2014"]-this["2010"]).toFixed(1)})'
On Windows:
curl "http://api.statbank.dk/v1/data/LIVO1/JSONSTAT?lang=en&Tid=2010%2C2014&AKTP=*" | jsonstat2arrobj -b Tid -l -d ContentsCode -t | ndjson-split | ndjson-format > dk.txt "${this['2014']>this['2010'] ? '\u2191' : '\u2193'} ${this['AKTP']}: ${this['2014']} (${this['2014']>this['2010'] ? '+' : ''}${(this['2014']-this['2010']).toFixed(1)})"