Have tasks in graph view show % of total execution time for that run? #62935
Description
Description
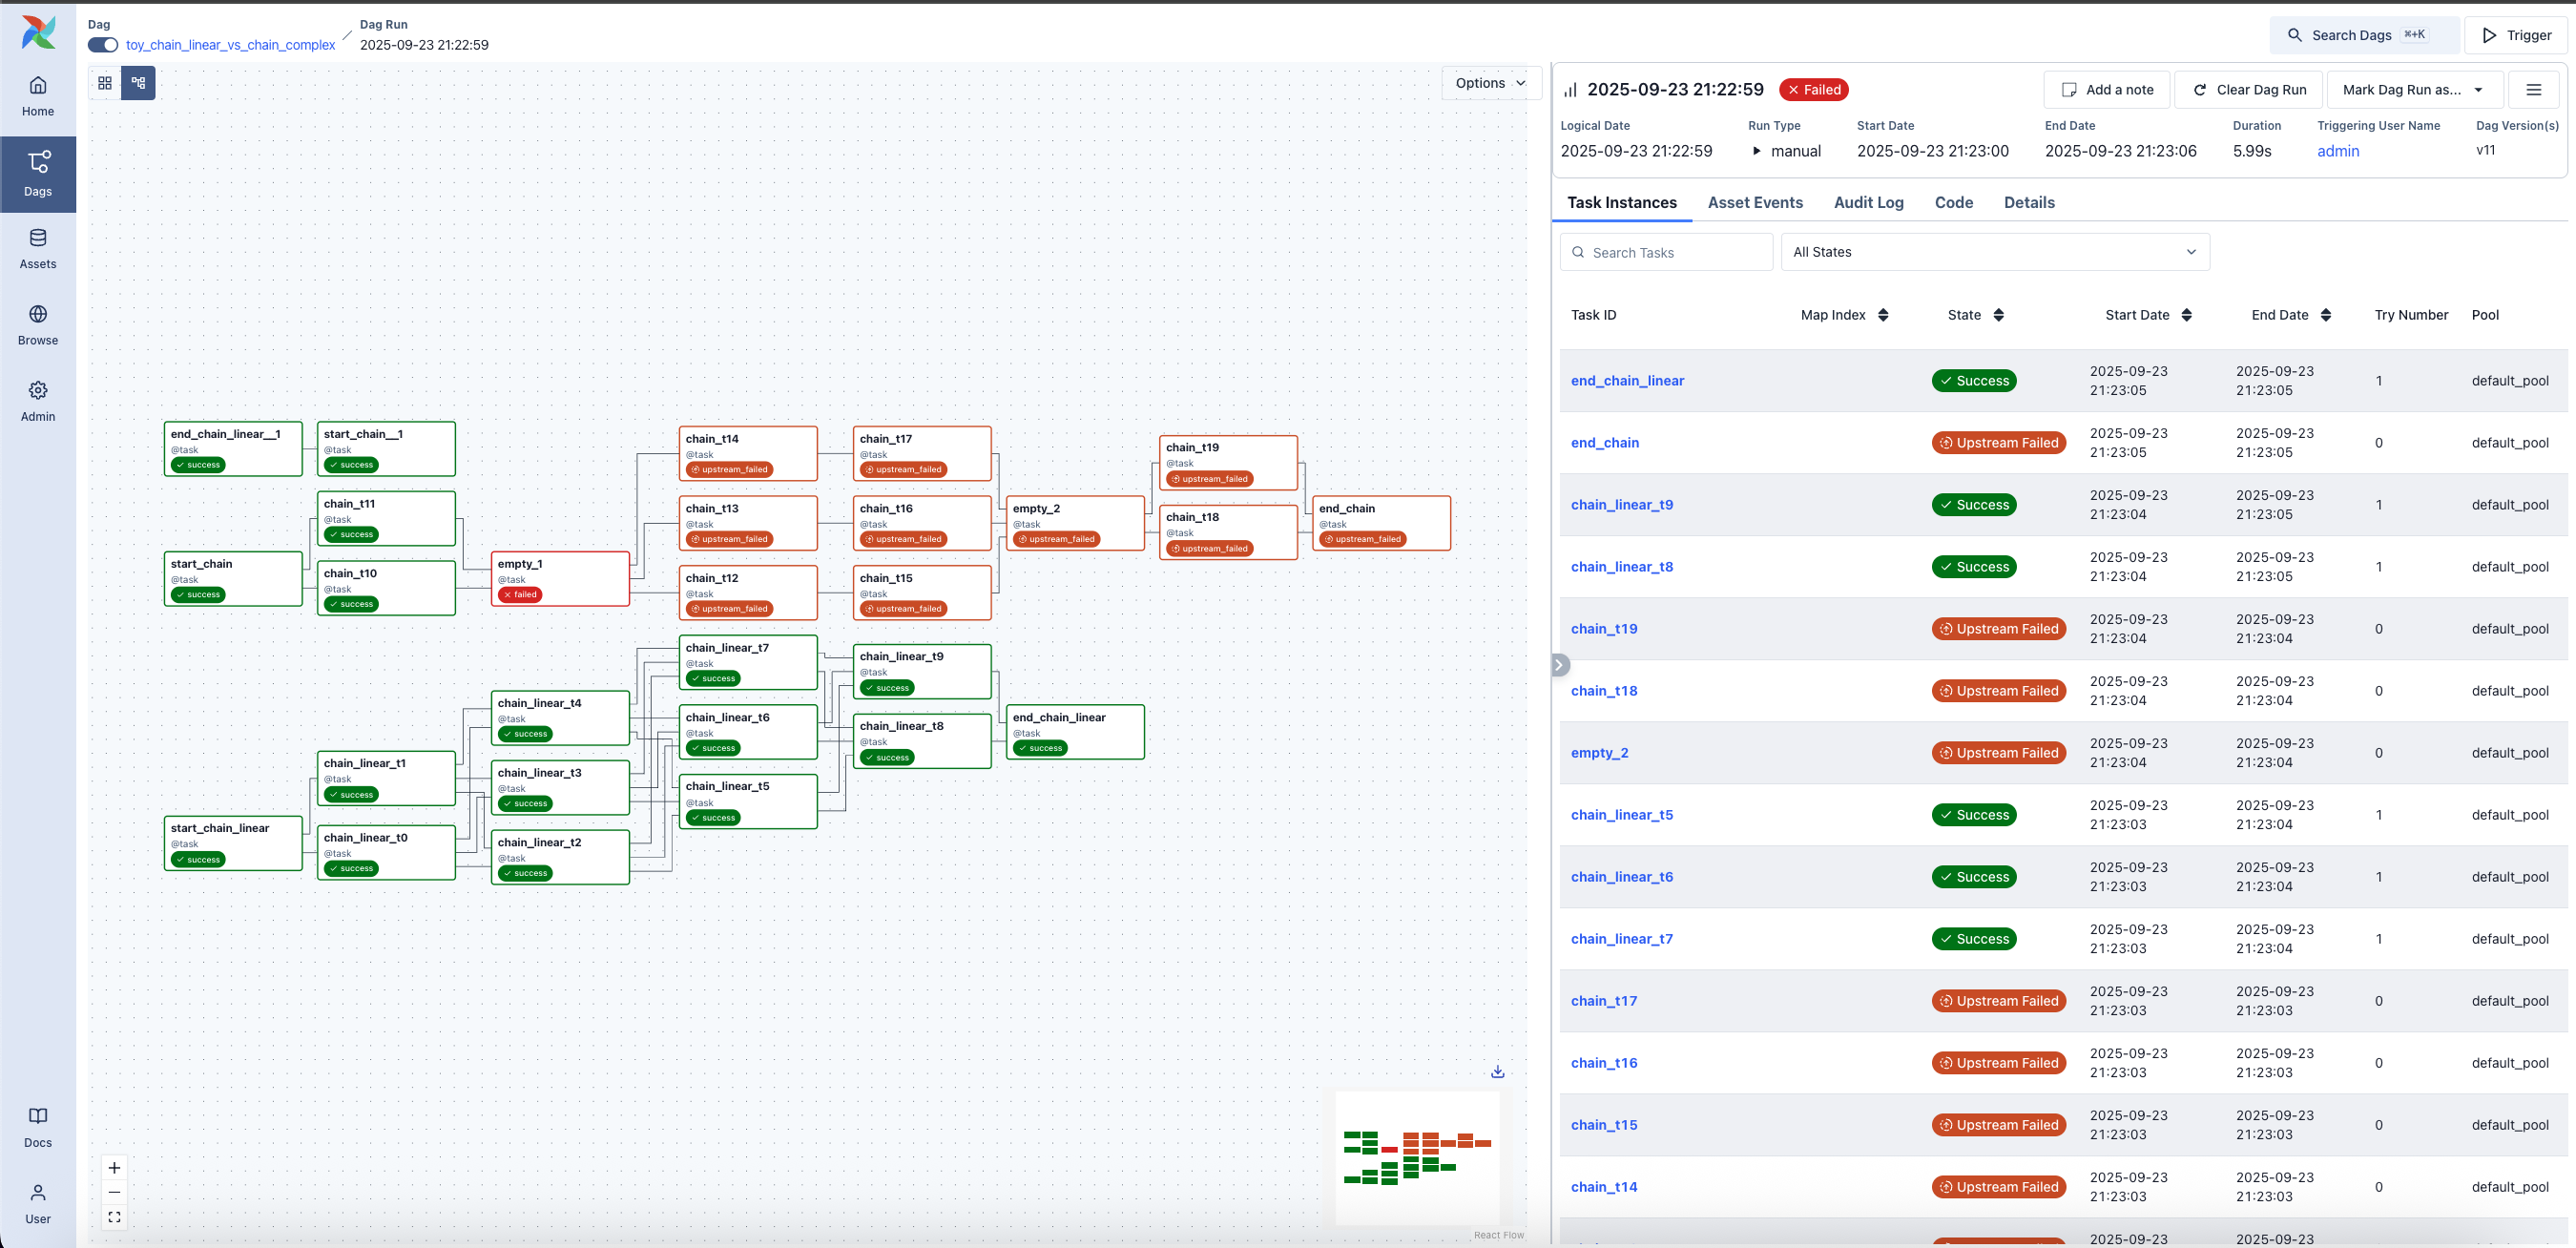
In graph view, show the % of that tasks' execution time compared to total execution time of the dagrun. I've also seen other cases where a small bar graph is shown in the task rectangle but I think % is probably good enough.
it would be really helpful to see at a glance from the graph view which tasks are taking the longest.
https://airflow.apache.org/docs/apache-airflow/stable/_images/dag_run_graph1.png
Use case/motivation
for quickly triaging a long running dagrun
Related issues
No response
Are you willing to submit a PR?
- Yes I am willing to submit a PR!
Code of Conduct
- I agree to follow this project's Code of Conduct