Skip to content
New issue

Have a question about this project? Sign up for a free GitHub account to open an issue and contact its maintainers and the community.

By clicking “Sign up for GitHub”, you agree to our terms of service and privacy statement. We’ll occasionally send you account related emails.

Already on GitHub? Sign in to your account

Output of delay differential equation system not as expected #1

Open
andreaskuster opened this issue Oct 11, 2019 · 1 comment
Open
Assignees
Labels
bug Something isn't working

Comments

@andreaskuster
Copy link
Owner

andreaskuster commented Oct 11, 2019

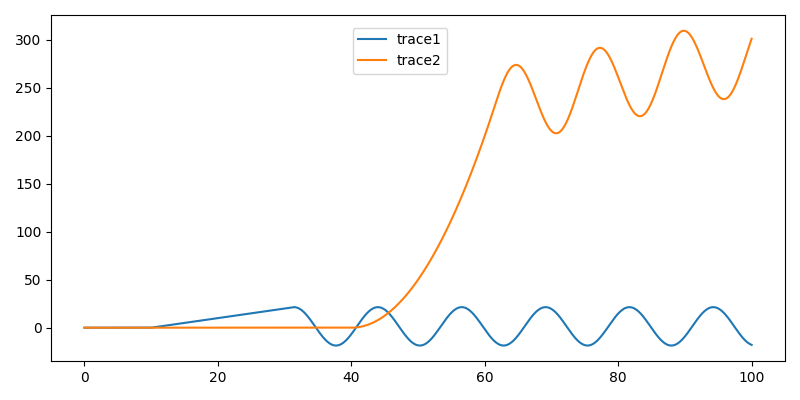
The simulation with our system of delay differential equations (to model the phages from infection to the burst of the cell) is broken in the current implementation.
(1) The simulation result does not behave as expected. (I will review your code for any bugs, You should do this too.)
(2) From my understanding, JiTCDDE does not support piecewise defined functions (we could use a sharp sigmoidal function, but this makes thinks more complicated and is kind of hackish). This is a mandatory requirement i.e. for defining 'sharp' temperature profiles. I will look around for a different library that natively supports this feature.

@andreaskuster andreaskuster added the bug Something isn't working label Oct 11, 2019
@andreaskuster
Copy link
Owner Author

andreaskuster commented Oct 11, 2019

i found ddeint, a python library providing all our required capabilities. Please update your implementation to be compatible with ddeint. I wrote a small getting started example for you:

import numpy as np
from ddeint import ddeint
from pylab import array, sin, linspace, subplots

tau = 30.0


def foo(t):
    if t < 10.0:
        return 0.0
    elif 10.0 <= t < 10.0 * np.pi:
        return 1.0
    else:
        return 10.0 * sin(t * 0.5)


def values_before_zero(t):
    return array([0.0, 0.0])


def model(Y, t):
    x, y = Y(t)
    x_tau, y_tau = Y(t - tau)
    return array([foo(t), x_tau])


tt = linspace(0, 100, 1000)
yy = ddeint(model, values_before_zero, tt)

fig, ax = subplots(1, figsize=(8, 4))

ax.plot(tt, [x[0] for x in yy], label="trace1")
ax.plot(tt, [x[1] for x in yy], label="trace2")
fig.legend(loc='upper center', borderaxespad=2.0)
fig.show()

The function foo(t) is a piecewise defined and the delay differential equation trace2 looks plausible (30ish units 'behind' foo(t)).

image

Sign up for free to join this conversation on GitHub. Already have an account? Sign in to comment
Labels
bug Something isn't working
Projects
None yet
Development

No branches or pull requests

2 participants