**Settings** - All rates are equal: exposure rate, infection rate, mortality rate |set|rate| |-|-| |1|0.01| |2|0.02| |3|0.03| |4|0.04| |5|0.05| - 300 its - Sets: 5 - Runs: 16 runs per set - Output: only Eurostat memvars, ratios of population that are susceptible, exposed, infected, removed - Shown in plots: median (thick curve), 25th and 75th percentiles (thin curves around the median) 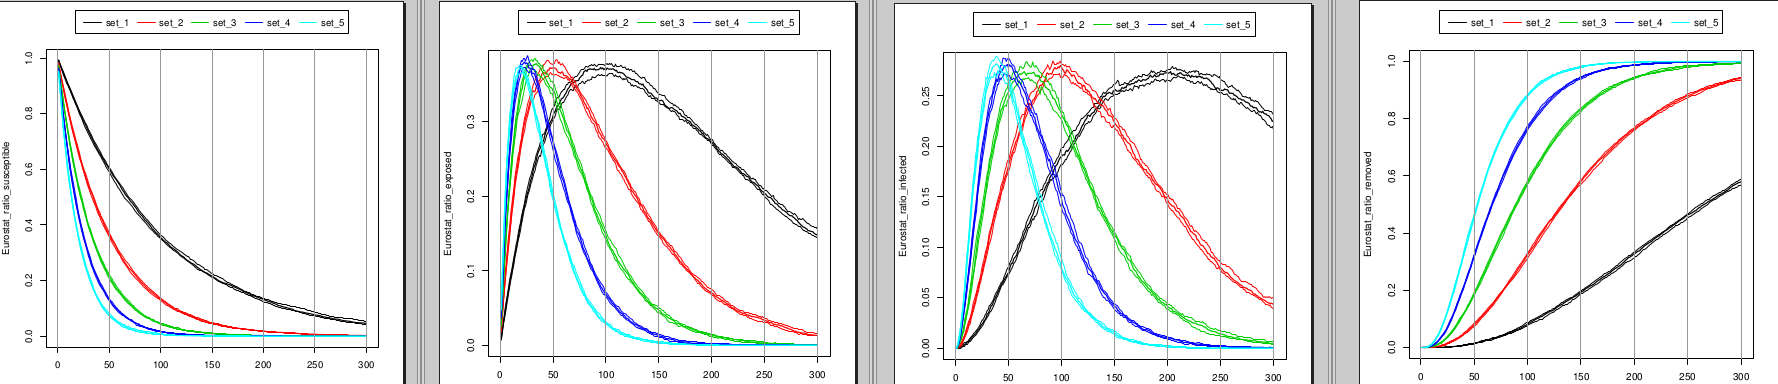
Settings